US30 is not slowing down for anyone...We will not go below 39570 in the short term, Watch the levels 41000, 41140, 41430. All three targets will hit. US30's bullish momentum is only building up not slowing down. Load up 39570-39700 and Thank me later :)
Market indices

Is DXY still bullish?My major trend was not broken either Friday nor Today.. I am still accessing whether DXY is still bullish. There some signs that DXY wants to to turn bearish. But I have not seen any confirmation and will wait on my trend to be broken before changing my bios. Let me know what you think.. Have dxy turn bearish?

Perfect analysis and advice, hope to help you!Hello, traders
I thought Nas100 would be bearish this week as we swept pMH and made new highs and I could be wrong. On the chart, I marked PDH and PDL, I found an IFVG in 1HR, the price did not relieve, so once the price swept PDH and alleviated IFVG, we went short.
What do you think? Let's be happy trading

This analysis and strategy looks good!Dow Jones (US30) has reacted off the pivot and could potentially drop to the 1st support.
Pivot: 39,993.29
1st Support: 39,637.89
1st Resistance: 40,530.41

Dxy analysis for the week Dxy already hit tp1 and is now consolidating in a zone where it’s either creating a higher low (#2) of a bearish Elliot wave structure or expanding higher to break the range for its target of liquidity resting above the x and d legs of the harmonic
Keeping eyes on it
Correlation to keep In mind is:
If Dxy bullish then
Xxxusd pairs bearish
USDxxx pairs bullish
And vice versa

nas100 drops after a bullish momentumthere is volume behind the first fair value gap take short partials at 18640,5 for safe entries,possibly at 18707.3 for sniper entry reminder always risk 10% of your money...sl:18722.2

CHART BREAKDOWN US30: Key Levels, Targets and Thoughts!🎯Brief Description🖊️:
The chart provides insights into critical market levels, emphasizing an essential supply zone (medium-risk sell zone) spanning from 39600 to 39570, respectively, are highlighted.
Things I Have Seen👀:
Medium-Risk Buy Zone🟠: Noted between 39600 and 39570, suggesting another area with moderate risk for potential buying positions.
Bullish Targets📈:
39700: Possible retracement area.
39850: Possible retracement area.
40100: Area with a lot of liquidity.
What's Important Now❗
Currently, the crucial approach is to wait and observe the price action at this level. We need to assess how the market reacts before considering any decisive moves. Stay observant and responsive to real-time developments in the market.

CHART BREAKDOWN NASDAQ: Key Levels, Targets and Thoughts!🎯Brief Description🖊️:
The chart provides insights into critical market levels, emphasizing an essential demand zone (low-risk buy zone) spanning from 18330 to 18315, respectively, are highlighted.
Things I Have Seen👀:
Important Demand Zone🟢: Identified between 18330 and 18315, serving as a low-risk buy.
Bullish Targets📈:
18400: Possible retracement area.
18500: Possible retracement area.
18580: Possible retracement area.
18670: Area with a lot of liquidity.
What's Important Now❗
Currently, the crucial approach is to wait and observe the price action at this level. We need to assess how the market reacts before considering any decisive moves. Stay observant and responsive to real-time developments in the market.

DXY trend probability this is very tricky and I'm not sure but it seems like FED and HedgeFunds are playing big trap game.

S&P500 is benefiting from the bearish momentum on DXYHey Traders, in today's trading session we are monitoring US500 for a buying opportunity around 5250 zone, US500 is trading in an uptrend and currently is in a correction phase in which it is approaching the trend at 5250 support and resistance area.
Trade safe, Joe.

2024-05-20 - a daily price action after hour update - daxGood Evening and I hope you are well.
overall market comment
Markets moved mostly sideways today but commodities are on a tear, except for Oil. We can expect more volatility on the commodities side, since they are in play and everyone want’s some. Be humble to net get caught on the wrong side and have strong momentum on your side. For stock indexes I expect either another leg up which could start tomorrow or a bigger pull-back to the daily 20 ema.
dax
comment: Tight trading range 18800 - 18890. Absolutely neutral inside that range. Bulls only managed to get to around 50% pull-back from ath to 18700, which is weak but since bears could not even close the gap to Friday, that’s even more pathetic. Expecting more sideways until the triangle from the right shoulders breaks.
current market cycle: trading range - bulls broke 19000 but no follow through.
key levels: 18700 - 19000 - below 18700 is 18400 next.
bull case: Bulls keeping this at the highs and 300 points above the daily 20ema. As long as they keep this above 18700, they are in full control and higher highs are possible. For tomorrow I expect they will close the gap to 18850 and try higher again. The small bear trend line is their next resistance.
bear case: Bears kept it below the 50% pb most recent low to high. Market formed a head & shoulders pattern which fails more than it breaks down. It’s a continuation pattern and bears do not have the odds on their side here. They need to close the gap to 18792 and then retest 18700. For now I can’t see the market breaking that level without any catalyst.
short term: Bearish below 18880 and bullish above for test of 19000 or higher. Head & Shoulders break down confirmed with 15m close below 18700 for target 18400 or lower.
medium-long term: My long term outlook stays bearish and I expect at least a -20% correction in 2024. Medium term is 17100 while I think we can touch the big bull trend line starting 2022-10 around 16700 in 2024. —unchanged
trade of the day: Long from the EU open was ok, since bears could not close the gap to Friday. Bullish enough for target 18900ish.

Using S5TH (spx stocks above 200dma) as an oscillator timing cycPretty cool feature. You can use the 9month moving average in S5TH (spx stocks above the 200dma) to time the market cycle. Figure out the upward momentum (with help of game theory and TNX cycle). In practice and theory peoples options should be predictable because everyone act in their self-interest, seeking safety (hypothetical riskfree) and potential.
I use this as an oschilator (like RSI).. above 50% reading is bull market (because more than 50% stocks above it's 200dma).
This thing points to bull market to at least like 2025 summer. Worth noting that business cycle and TNX patterns are key here.

S&P500: Wait for the ideal level to rebuy.The S&P500 index is neutral on its 1D technical outlook (RSI = 44.135, MACD = 2.270, ADX = 26.567) despite the fact that it made a new All Time High, in fact turning the former R level into S. The uptrend is being supported by the 4H MA50 since the May 2nd breakout and the Channel Up presents a new low risk buy opportunity close to the 4H MA100, ideally when the 4H RSI approaches the 30.000 limit. We will wait for the opportunity to go long and target the top of the Channel Up (TP = 5,400).
See how our prior idea has worked out:
## If you like our free content follow our profile to get more daily ideas. ##
## Comments and likes are greatly appreciated. ##

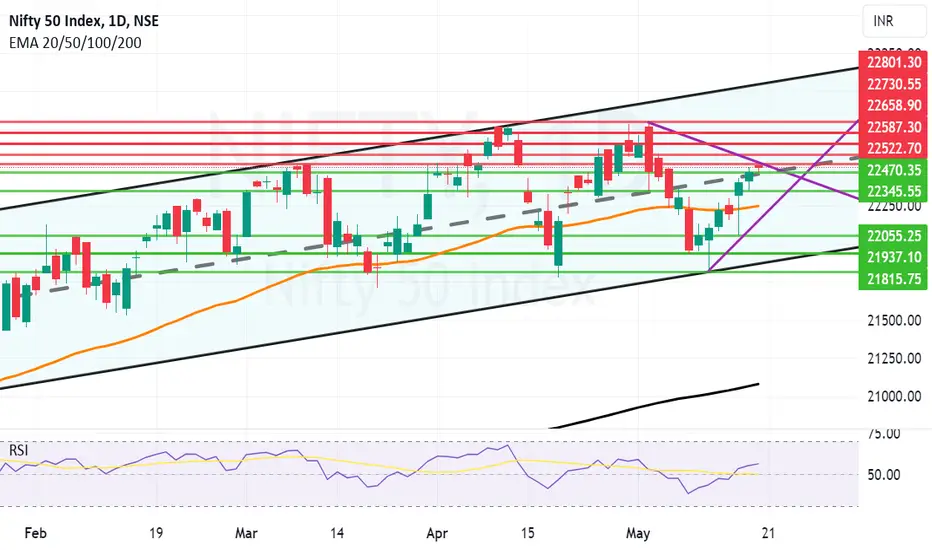
Good move ahead if mid channel support is held by NiftyGood move ahead for Nifty can hold the levels of 22470 and give a closing above 22522. Incase we get a closing above 22522 the resistances ahead will be 22587, 22658, 22730 and 22800+. In case Nifty gives a closing below 22470 the supports will be at 22345, 22246 and 22055. 22522 is however a strong trendline resistance and gap up opening and holding above it is the way to overcome it faster. Shadow of the candle is positive for the beginning of the week.
The End & The BeginningThis will be our final public post
The collapse of modern society and capitalism has begun
We must focus on preparation
May you all be safe

5500 Deutche Bank? How do you suppose?We are at a very powerful trend line resistance area and I'm not bearish. If we break 5150 on the s&p500 I'll become very bearish. I'm already bullish SQQQ and UVIX, UVXY, VXXB Long VIX ETNs.

Nasdaq- higher until $18858 / $19115 / $19319Using multiple fibs from multiple time frames,
we should see a pull back at $18858 while heading toward the 5th wave at $19319 with a pause/correction around $19115
Blue line from wave 3 to anticipated wave 5 is the same length as wave 2 to wave 4. Therefore arriving at $19319 - final 5th wave.
Starting at the bottom of wave 4 using Fib extension, we plot levels at 89; our closest level for a correction area to our current price.
yellow Fib level .236 at $18858 is a fib retracement level from the weekly chart between level $16587 and $26211; another point of interest.
If a strong reaction at $19319, we should see a 18% correction on the weekly toward $16k

Dollar breaking swinging longsDouble bottom is the last confirmation of the descending triangle the we were followed by a floating bullish flag (secondary confirmation/not an initial confirmation to form new pattern),
The breakout confirms our buys and nothing can stop us.

DXY - LONGDXY - LONG
look for the buy setups on DXY, very high chance to push up.. risk small and always use SL.
V.Ragu

Nasdaq Not Over Yet !Hi mates sharing a long view on Nasdaq as price break resistance (18350) and sustaining very well above and by the today's candle price breached the high of breakout candle too which is a good sign for resistance breakout so from here onwards i am looking some more upside movement in coming sessions friends. Traget meausured from the swing high to swing low made before this breakout and by the rising resistance line too and it seems logical too me.
Breakout retest- So as we can see that a proper breakout retest not happened so far after breakout which could provide the best entry as we can minimize our risk in any of trade by these type of retest entries as price earlier retested too it's breakout mentioned on provided chart, Rest i will update idea accordingly whenever needed and good to share anything about this publication.
This idea is meant for only educational purpose this not any kind of trading or investment advice.
Best Regards- Amit

JPN225 Buy SetupMonthly & Weekly timeframe above the could
H4 breaking out the cloud for a buy setup

AUS200 (Long Setup)Everything has mentioned in the chart.
Buying divergency on 4H time frame.
Hammer on demand Zone
Buying volume increasing
Target the current supply zone.
wait for price to get to the demand zone again.
thank you for reading.

US30 SELL NOW!!!!!!!!!!US30 Made a new highs today completing my last previous analysis predictions on us30 now price just run liquidity at 39900 am expecting further drops on us30 till 37800 is completed now am looking for bearish moves
JOIN AND ENJOY..........
