The power of community
Get inspiration for your next trade. Don't reinvent the wheel.

KOTAKMAHINDRA - Still a bet to hold? So, yesterday we had a sudden news flow in this script which was -
"RBI barred issuance of new sign-ups through online onboarding and halts issues of new credit cards".
What lies ahead for NSE:KOTAKBANK after the RBI ban?
Let's take a dig down to its price chart for much better understandi

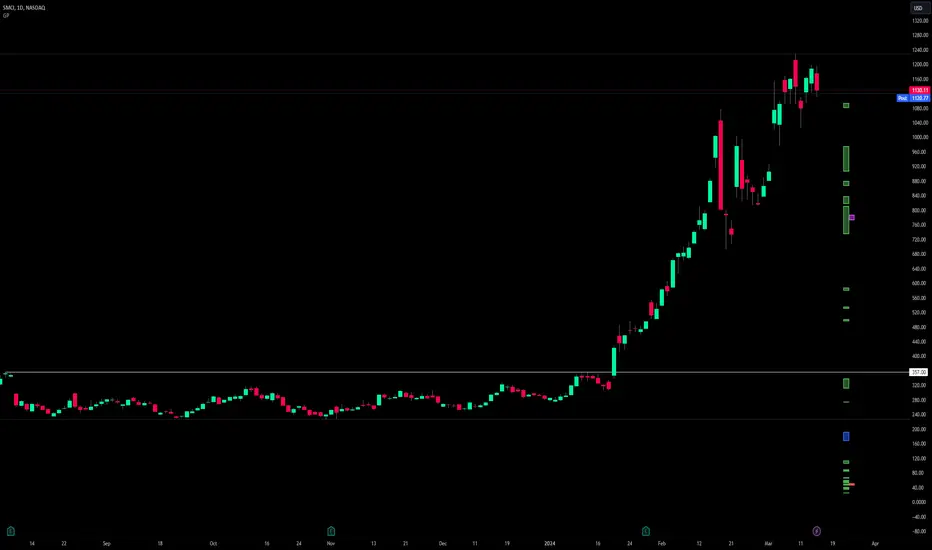
What kind of crazy person looks at 1300 candles?Hello everyone! Hope you are all well!
To answer the question above...anyone who wants to ride an enormous trend.
In PhiCube methodology, we study the relative behavior of fractals separated by a factor of 4.236 (Phi raised to the third power - Phi Cubed = PhiCube).
If we consider a single cande

Short Covering in GBP/USD - Trend Reversal The trend is your friend! I agree but the trend is also meant to be bought at the low and meant to be sold at the high.
We have used the Fibonacci to determine that buying is a high-probability trading decision this morning.
We have seen a pullback into the buy zone on the 15 Mins chart.
The area of

EURNZD - Seize Profitable Opportunity with Anti-Shark PatternEURNZD is currently exhibiting the formation of an Anti-Shark Harmonic Pattern (XABCD) coupled with the presence of a significant Trendline, indicating potential bearish momentum on the horizon. This analysis delves into the technical factors influencing the currency pair's movement and proposes str


Tesla's upcoming Robotaxi launch: stock trading idea 8/04/24Tesla Inc. is gearing up for a significant reveal on 8 August this year, as it plans to introduce its much-anticipated robotaxi. This move comes at a time when the company is navigating sluggish sales and increasing competition from more affordable Chinese electric vehicles. Elon Musk, the CEO of

(NASDAQ:TESLA) STOCK UNDER $100.00?WATCH SUPPORT LEVELS TO PAY ATTENTIO!
Short Term Price Target
$155.27 to 146.54
1. Tesla's Stock Price Below $100.00: The fact that Tesla's stock could drop below $100.00 suggests a significant bearish sentiment in the market. Investors may be concerned about the company's performance or broader

Bitcoin: is price set to get cheaper or.....?Today's focus: BTCUSD
Pattern – Range, seller test.
Support – 62,000 area
Resistance – 73,000 area
Hi, traders; thanks for tuning in for today's update. Today, we are looking at BTC on the daily.
With sellers continuing to check buyers, it continues to look like we could see a new move at supp

Weekly Technical Analysis 15/04/2024Start your week by identifying the key price levels and trends.
The SpreadEx Research team has analysed the most popular markets, including stocks, indices, commodities & forex.
*KEY
Trend direction is set by the slope of the VWAP
Trend phase is determined by the current price relative to the VWAP

See all editors' picks ideas
Learn the ins and outs of trading.
Assessing Market sentiment using the Vix and Dxy 📑Hello Traders and welcome back to another Video analysis. We break down the relationship amongst different asset classes when gauging market sentiment. In particular, how to analyze market direction on the Nasdaq 100 by looking at the Volatility and Dollar Indexes. We combine this sentiment analysis

GBPUSD: Bullish Momentum Ahead! Friday Trading OutlookGreetings Traders!
In this video, I'll provide a comprehensive analysis of the DXY and GBPUSD, offering insights into what to anticipate in tomorrow's trading session. We've reached a crucial juncture on both the DXY and GBPUSD charts, so what lies ahead?
Stay tuned for valuable insights, and feel

Portfolio Beta Hedging Ahead of Super Seven EarningsYou cannot predict the future. But you can prepare for it. Mega cap tech stocks have collectively lost USD 930 billion in value since Nasdaq 100 peaked on 21st March 2024. Will Super Sevens earnings turn the tide?
Starting this week, the Super Sevens will start announcing first quarter results. N

Why Would Countries Devalue Their Currency?Why Would Countries Devalue Their Currency?
Currency devaluation is a nuanced aspect of fiscal policy with profound implications globally. This article demystifies the strategic reasons and consequential effects when nations choose to devalue their currency. From influencing trade balances to adju

How to use Williams Alligator Indicator in crypto trading?You have probably heard about Alligator, indicator which is used by top crypto traders. This powerful tool can increase performance of every cryptocurrency trading strategy and help you to make money on the market. Alligator gives us the precise answer if now price is in impulsive or reactive wave.

Bitcoin vs. Ethereum: Deciphering the DistinctionsCryptocurrencies have revolutionized the financial landscape, with Bitcoin and Ethereum emerging as two prominent players shaping the digital economy. Despite sharing the common ground of blockchain technology, each offers distinct features and functionalities, underscoring the need to understand th

what currencies to buy in times of geopolitical tensions. In times of geopolitical turmoil or war, investors often seek refuge in currencies perceived as safe havens. several currencies are considered safe harbors due to their stability, liquidity, and low risk of depreciation. Some of the notable safe-haven currencies include:
1-US Dollar (USD): The US d

Mind the Gap: How to Trade Price GapsThe Power and Beauty of Price Gaps
Price gaps represent a clear imbalance in supply and demand, making them one of the purest representations of momentum in financial markets. These gaps occur when there is a significant disparity between the closing price of one period and the opening price of th

1-Indicator Strategy For Beginners...The Stochastic Hey Rich Friends,
Happy Wednesday!
I wanted to share one of my top 3 favorite indicators with you.... The Stochastic (STOCH). As a leading (vs lagging) indicator, it is perfect for beginners because you can find entry and exit signals with only a few key details.
Adding the STOCH to your cha

Keltner Bands Pullback StrategyHere we take a look at trading pullbacks using the Keltner Channels. I cover the initial setup, the types of entries, and trades to avoid.
This setup contains 3 parts:
The channel touch
The Pullback
The Entry
The Channel Touch
Here is an example of the beginning signal in our setup, a b

See all editors' picks ideas
Trading explainers – why read when you can watch instead?
Assessing Market sentiment using the Vix and Dxy 📑Hello Traders and welcome back to another Video analysis. We break down the relationship amongst different asset classes when gauging market sentiment. In particular, how to analyze market direction on the Nasdaq 100 by looking at the Volatility and Dollar Indexes. We combine this sentiment analysis
GBPUSD: Bullish Momentum Ahead! Friday Trading OutlookGreetings Traders!
In this video, I'll provide a comprehensive analysis of the DXY and GBPUSD, offering insights into what to anticipate in tomorrow's trading session. We've reached a crucial juncture on both the DXY and GBPUSD charts, so what lies ahead?
Stay tuned for valuable insights, and feel
Short Covering in GBP/USD - Trend Reversal The trend is your friend! I agree but the trend is also meant to be bought at the low and meant to be sold at the high.
We have used the Fibonacci to determine that buying is a high-probability trading decision this morning.
We have seen a pullback into the buy zone on the 15 Mins chart.
The area of
1-Indicator Strategy For Beginners...The Stochastic Hey Rich Friends,
Happy Wednesday!
I wanted to share one of my top 3 favorite indicators with you.... The Stochastic (STOCH). As a leading (vs lagging) indicator, it is perfect for beginners because you can find entry and exit signals with only a few key details.
Adding the STOCH to your cha
Keltner Bands Pullback StrategyHere we take a look at trading pullbacks using the Keltner Channels. I cover the initial setup, the types of entries, and trades to avoid.
This setup contains 3 parts:
The channel touch
The Pullback
The Entry
The Channel Touch
Here is an example of the beginning signal in our setup, a b
Bitcoin: is price set to get cheaper or.....?Today's focus: BTCUSD
Pattern – Range, seller test.
Support – 62,000 area
Resistance – 73,000 area
Hi, traders; thanks for tuning in for today's update. Today, we are looking at BTC on the daily.
With sellers continuing to check buyers, it continues to look like we could see a new move at supp
Futures Day Trading with Volume ProfileToday was yet another amazing trade off a long term volume profile level for over 50 points on the CME_MINI:ES1! S&P500 E-mini futures.
I want to document these trades as teachable moments because I think Volume Profile is an absolutely amazing tool that should be in ever trader's toolbox!

TradingView Masterclass: The power of Bar Replay🚀 Unlocking Your Trading Potential with Bar Replay on TradingView
In the whirlwind of trading, having ace tools up your sleeve can dramatically shape your strategy and success. The spotlight shines bright on TradingView’s Bar Replay feature, a gem that offers a rewind on market movements,

See all editors' picks ideas
Trading indicators and strategies built by our community.
Percent Rank HistogramThis Pine script indicator is designed to create a visual representation of the percent rank for multiple financial instruments. Here's a breakdown of its key features:
Percent Rank Calculation:
The core functionality of this Pine script indicator revolves around the calculation of the percent r

Heat Map SeasonsHeat Map Seasons indicator
Indicator offers traders a unique perspective on market dynamics by visualizing seasonal trends and deviations from typical price behavior. By blending regression analysis with a color-coded heat map, this indicator highlights periods of heightened volatility and helps

Index Generator [By MUQWISHI]▋ INTRODUCTION :
The “Index Generator” simplifies the process of building a custom market index, allowing investors to enter a list of preferred holdings from global securities. It aims to serve as an approach for tracking performance, conducting research, and analyzing specific aspects of the glob

Higher-timeframe requests█ OVERVIEW
This publication focuses on enhancing awareness of the best practices for accessing higher-timeframe (HTF) data via the request.security() function. Some "traditional" approaches, such as what we explored in our previous `security()` revisited publication, have shown limitations

Trailing Management (Zeiierman)█ Overview
The Trailing Management (Zeiierman) indicator is designed for traders who seek an automated and dynamic approach to managing trailing stops. It helps traders make systematic decisions regarding when to enter and exit trades based on the calculated risk-reward ratio. By providing a cle

Periodic Activity Tracker [LuxAlgo]The Periodic Activity Tracker tool periodically tracks the cumulative buy and sell volume in a user-defined period and draws the corresponding matching bars and volume delta for each period.
Users can select a predefined aggregation period from the following options: Hourly, Daily, Weekly, and Mo

Gaps Profile [vnhilton]Note: If you get an error preventing indicator from executing due to a loop running longer than >500ms, please lower the amount of boxes shown and/or increase the minimum gap % threshold.
OVERVIEW
The Gaps Profile (GP) simply shows the remaining gaps on the chart that have yet to be closed. Gaps
TTrades Daily Bias [TFO]Inspired by @TTrades_edu video on daily bias, this indicator aims to develop a higher timeframe bias and collect data on its success rate. While a handful of concepts were introduced in said video, this indicator focuses on one specific method that utilizes previous highs and lows. The following des

Risk Management Chart█ OVERVIEW
Risk Management Chart allows you to calculate and visualize equity and risk depend on your risk-reward statistics which you can set at the settings.
This script generates random trades and variants of each trade based on your settings of win/loss percent and shows it on the chart as dif

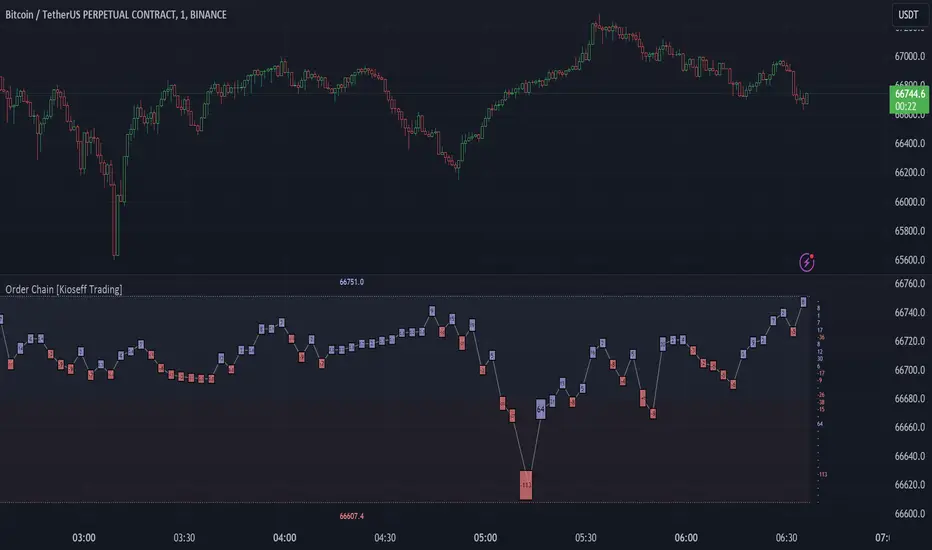
Order Chain [Kioseff Trading]Hello!
This indicator "Order Chain" uses live tick data (varip) to retrieve live tick volume.
This indicator must be used on a live market with volume data
Features
Live Tick Volume
Live Tick Volume Delta
Orders are appended to boxes, whose width and height are scaled proportional to th
See all editors' picks scripts