Explore the community
Get inspiration for your next trade. Don't reinvent the wheel.

Apple - Back to no.1 in the world!NASDAQ:AAPL is back to being no.1 in the world after rallying 11% in two days.
After moving higher +25% over the past two months, Apple is now back to being the most valuable company in the world with a market cap of 3.4 trillion dollars. This means that Apple is now back to leading the indices

WTI Oil H4 | Potential bullish bounceWTI oil (USOIL) is falling towards a pullback support and could potentially bounce off this level to climb higher.
Buy entry is at 77.52 which is a pullback support.
Stop loss is at 76.30 which is a level that lies underneath a pullback support and the 38.2% Fibonacci retracement level.
Take prof

Injective Weekly AnalysisInjective (INJ) has been the biggest gainer of the week with a robust increase of 20.43%. After reaching an all-time high (ATH) of $53.01, INJ experienced a significant sell-off, filling the Fair Value Gap (FVG) on the daily timeframe and touching a low of $18.70 before quickly bouncing back. Curren

Bitcoin 1.2B of Oi is trapped. How WHALES WOULD TRADE IT?Bitcoin 1.2B of Oi is trapped. How WHALES WOULD TRADE IT?
iN A VIDEO I SHARED MY IDEA ABOUT btc and how i plan to trade it
Price at this moment is in middle of local range - i prefer to take a trade after Clear SL hunts and squeezing. Becasue those trapped trades should be liquidated

Weekly Analysis & Market Crash PredictionHere's a video going over what I'm watching heading into the week and what I expect leading up to FOMC. I'll do some more FOMC and market analysis before then as we get closer to Wednesday. Overall, I don't expect much, I think we'll have downside and chop until then. Either way, any moves made on M

Bearish Reversal Insight AUDCAD Technical Analysis & Trade SetupThe AUDCAD currency pair is currently forming a Bearish Butterfly Harmonic Pattern (XABCD), indicating a potential bearish reversal. Point D, the Potential Reversal Zone (PRZ), is aligned with a key resistance area and intersects a daily trend line, providing a strong confluence for a bearish bias.

S&P 500 faces resistance ahead of crucial data and FOMC meetingThe bullish drive has been revived in US equity indices after a few weeks of downside pressure. The S&P 500 and the Nasdaq both broke to new highs on Wednesday driven mostly by technology stocks. The ADP May employment report also helped revive some buying appetite as it came in below expectations.

DAX rising weaklyMarkets rose on Wednesday, recovering losses from the previous session in anticipation of important data on regional activity and awaiting the ECB's latest monetary policy meeting. At the open, it was up 0.4%. It was followed by the French CAC40 and the FTSE 100 with 0.5% and 0.3% respectively, and

The TradingView Show: Charting Markets with TradeStationHello to all global traders! We're live with David Russell, TradeStation's Global Head of Markets giving us an inside look at the most important moves in markets. He’s the expert behind the research and analysis from TradeStation’s official TradingView account.
Follow them here: www.tradingview.

See all editors' picks ideas
Learn the ins and outs of trading.
Crypto Coins Heatmap: The Ultimate Guide for Beginners (2024)Discover the easiest way to track, group and sort your favorite tokens in one place — the TradingView Crypto Coins Heatmap.
Everyone — from the aspiring crypto enthusiast to the professional digital asset fund manager — needs it. Meet the ultimate cryptocurrency tracking and monitoring tool, the Tr

Past Indications of uptrend health in the SPXEven when all empires fall, It's important to remember that as long as humanity in general continues to discover, explore, solve and invent, the better off we all are. That's why the price of indices always tend to go up. Even when they become stagnant, they eventually keep on increasing. The only t

Top 3 Tips on How to Avoid FOMO Trading (Fear of Missing Out)Here you are, casually sipping your coffee and watching the clock go by while you wait for the market to open so you can buy a few shares of your new stock pick. Remember, you chose that one after deep research and careful planning.
And then “ WHAM! ” Twitter notifications start flying. GameStop (t

Using the Second Charts on TradingviewThis tutorial goes over the uses of the very low timeframe features that Tradingview offers, namely the 1 second through to the 30 second charts.
The main advantage to these timeframes is that they permit you to clearly see whether your support and/or resistance levels are being held or are being r

Differences between paper trading & real money tradingMost people (including me sometimes) lack the right mindset, patience, and planning when it comes to trading. There is no magic technical indicators in trading, it all comes down to simple tools, just like my paper trading journey outlined in this BTCUSD chart.
In the chart, I observed that:
BT


SPY Fibonacci Price Theory And BreakOut BarsThis instructional video teaches you the basics of Fibonacci Price Theory in conjunction with Breakout Bars and how price is the ultimate indicator.
Throughout this video, I try to provide instruction on key elements related to the Fibonacci Price Theory (Unique & Standout Highs/Lows). Additionally


New Product Launch: How to Use TradingView OptionsWe’ve rolled out our newest product and we’re eager to brag about it! It’s an options platform — TradingView Options. More precisely, it’s a powerful set of tools for options traders who want to keep a close eye on every little detail and fine-tune their strategy to perfection.
What Are Options?

See all editors' picks ideas
Trading explainers – why read when you can watch instead?
Apple - Back to no.1 in the world!NASDAQ:AAPL is back to being no.1 in the world after rallying 11% in two days.
After moving higher +25% over the past two months, Apple is now back to being the most valuable company in the world with a market cap of 3.4 trillion dollars. This means that Apple is now back to leading the indices
WTI Oil H4 | Potential bullish bounceWTI oil (USOIL) is falling towards a pullback support and could potentially bounce off this level to climb higher.
Buy entry is at 77.52 which is a pullback support.
Stop loss is at 76.30 which is a level that lies underneath a pullback support and the 38.2% Fibonacci retracement level.
Take prof
Bitcoin 1.2B of Oi is trapped. How WHALES WOULD TRADE IT?Bitcoin 1.2B of Oi is trapped. How WHALES WOULD TRADE IT?
iN A VIDEO I SHARED MY IDEA ABOUT btc and how i plan to trade it
Price at this moment is in middle of local range - i prefer to take a trade after Clear SL hunts and squeezing. Becasue those trapped trades should be liquidated
Weekly Analysis & Market Crash PredictionHere's a video going over what I'm watching heading into the week and what I expect leading up to FOMC. I'll do some more FOMC and market analysis before then as we get closer to Wednesday. Overall, I don't expect much, I think we'll have downside and chop until then. Either way, any moves made on M
Using the Second Charts on TradingviewThis tutorial goes over the uses of the very low timeframe features that Tradingview offers, namely the 1 second through to the 30 second charts.
The main advantage to these timeframes is that they permit you to clearly see whether your support and/or resistance levels are being held or are being r
The TradingView Show: Charting Markets with TradeStationHello to all global traders! We're live with David Russell, TradeStation's Global Head of Markets giving us an inside look at the most important moves in markets. He’s the expert behind the research and analysis from TradeStation’s official TradingView account.
Follow them here: www.tradingview.
XAUUSD | GOLDSPOT | New perspective | follow-up detailsGold has delivered impressive gains of over 18% so far in 2024, and June looks promising for investors. With finite supply and fluctuating demand, gold prices are sensitive to economic and geopolitical news. This video dives deep into the current market dynamics and what to expect in the coming mont

See all editors' picks ideas
Trading indicators and strategies built by our community.
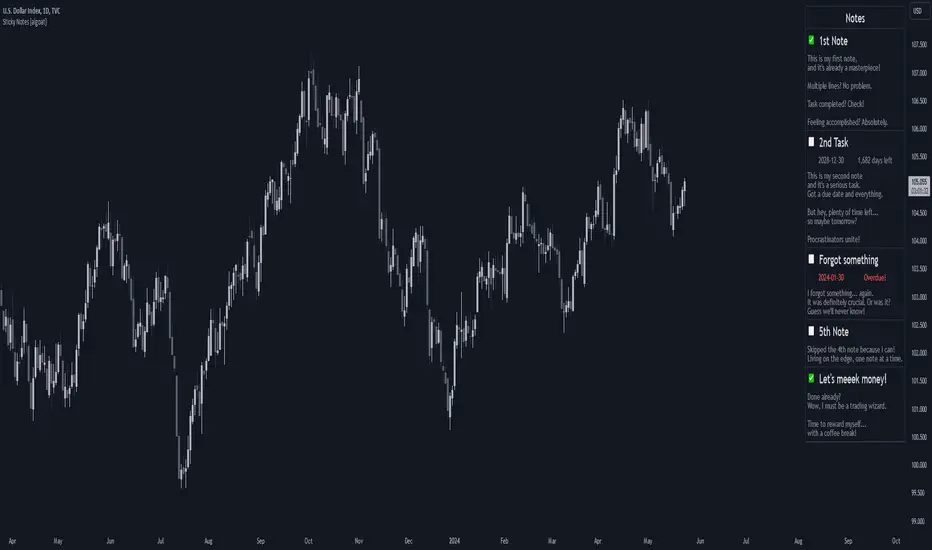
Sticky Notes, Checklist, To-do, Journal [algoat]I forgot to bring my notes again...
Ever feel like your trading notes are all over the place, much like your portfolio after a market dip? Worry not! With this script, you'll have all your trading notes, tasks, and brilliant (or not so brilliant) ideas neatly organized right on your chart. It's li
Ichimoku Theories [LuxAlgo]The Ichimoku Theories indicator is the most complete Ichimoku tool you will ever need. Four tools combined into one to harness all the power of Ichimoku Kinkō Hyō.
This tool features the following concepts based on the work of Goichi Hosoda:
Ichimoku Kinkō Hyō: Original Ichimoku indicator with

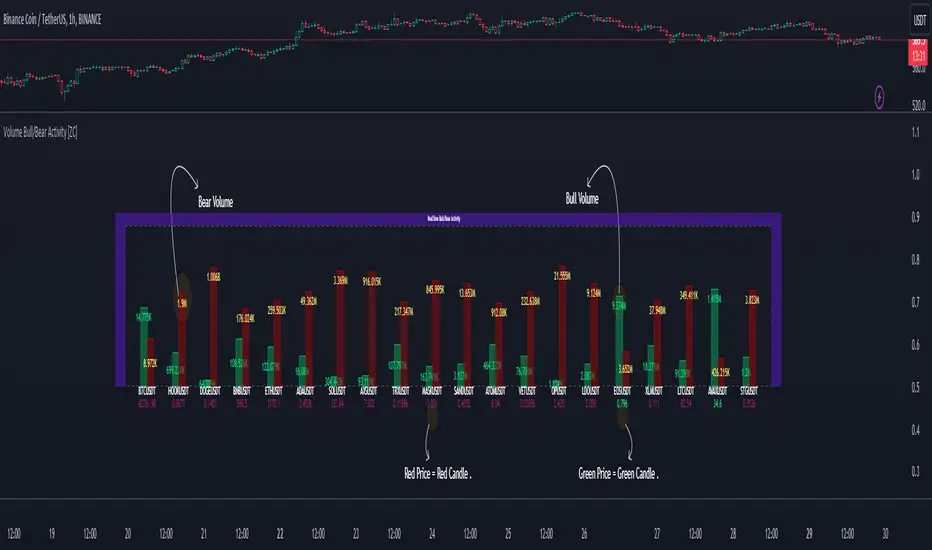
Volume Bull/Bear Activity [ZC]Volume Bull/Bear Activity Summary
This indicator generates a summary of bull/bear activity for 20 symbols.
For each symbol, two bars are displayed, colored green and red.
The green bar indicates bull volume, reflecting activity within the last candle of the symbol.
The red bar signifie
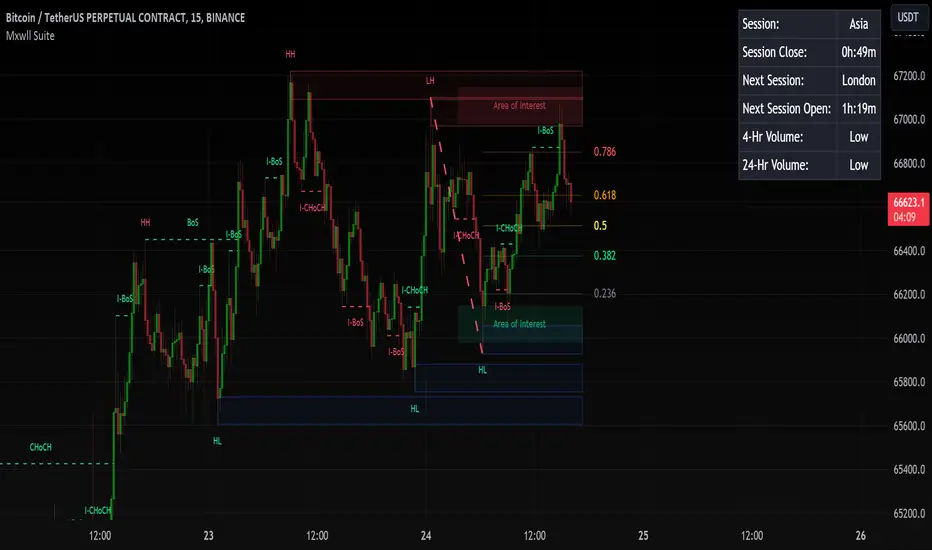
Mxwll Price Action Suite [Mxwll]Introducing the Mxwll Price Action Suite!
The Mxwll Price Action Suite is an all-in-one analysis indicator incorporating elements of SMC and also ideas extending beyond the trading methodology!
Features
Internal structures
External structures
Customizable Sensitivities
BoS/CHoCH
Order B
Percent Rank HistogramThis Pine script indicator is designed to create a visual representation of the percent rank for multiple financial instruments. Here's a breakdown of its key features:
Percent Rank Calculation:
The core functionality of this Pine script indicator revolves around the calculation of the percent r

Heat Map SeasonsHeat Map Seasons indicator
Indicator offers traders a unique perspective on market dynamics by visualizing seasonal trends and deviations from typical price behavior. By blending regression analysis with a color-coded heat map, this indicator highlights periods of heightened volatility and helps

Index Generator [By MUQWISHI]▋ INTRODUCTION :
The “Index Generator” simplifies the process of building a custom market index, allowing investors to enter a list of preferred holdings from global securities. It aims to serve as an approach for tracking performance, conducting research, and analyzing specific aspects of the glob

Higher-timeframe requests█ OVERVIEW
This publication focuses on enhancing awareness of the best practices for accessing higher-timeframe (HTF) data via the request.security() function. Some "traditional" approaches, such as what we explored in our previous `security()` revisited publication, have shown limitations

Trailing Management (Zeiierman)█ Overview
The Trailing Management (Zeiierman) indicator is designed for traders who seek an automated and dynamic approach to managing trailing stops. It helps traders make systematic decisions regarding when to enter and exit trades based on the calculated risk-reward ratio. By providing a cle

Periodic Activity Tracker [LuxAlgo]The Periodic Activity Tracker tool periodically tracks the cumulative buy and sell volume in a user-defined period and draws the corresponding matching bars and volume delta for each period.
Users can select a predefined aggregation period from the following options: Hourly, Daily, Weekly, and Mo

See all editors' picks scripts