junior miners to continue break higher to 43Large pennant formation over last few days. Cup and handle forming inside of ascending triangle. If can get above 41.80, should move towards yesterday resistance around 42.15, then break out to 43
invalidate if break traingle on 1hr close.
GDXJ trade ideas

Long Gold Miners1) Divergence in the 4hr RSI and MACD crossing over.
2) Price has touched the bottom of the downward trendline on Oct 06.
3) Support at 38.2% Fibo of the rally from Jan 2016 to Aug 2016
4) May see another downleg to sub 37 due to spiking USD but risk/reward is good for a bounce to 42
Risk/reward ratio is 3:1

GDXJ - Ending Diagonal In ProcessI'm seeing wave C possibly shaping up as an ending diagonal to complete wave 2 of the larger degree correction.
If the price movement follows the blue count on the chart, we should be going down in 3 waves a-b-c to form a bottom around the 50% retracement of the larger impulsive wave 1 high of 52.50, potentially going a bit lower.
This would be an excellent opportunity to catch the following impulsive wave 3 up which will very likely take the GDXJ all the way up to 100 and above.


GDXJ & GDX : Selloff will continue if 39 does not holdFinishing Head and Shoulders formation at GDXJ... If we get a drop to 36 and a retest of 39 the next target will be 29-30 region


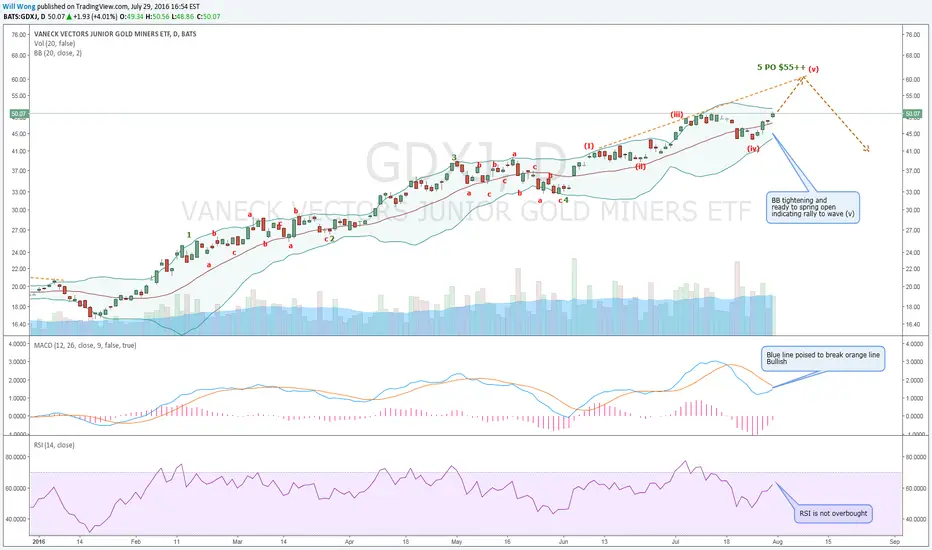
GDXJ-inal stages of wave 5. Target $55++Gold Miners have had a wonderful run but is clearly in its final stages of wave 5. Expect a healthy pull back soon.

SOLD GDXJ SEPT 16TH 45 PUT.... for a .67 ($67)/contract credit.
This and $GDX are currently probably the highest implied volatility exchange-traded funds, so I'm just selling a little premium here without taking on the upside risk that doing a strangle would entail.
That being said, I'm fairly sure I don't want to be put GDXJ at 45 (lower would be preferred for a long position), so I will watch it and roll down and out to an expiry in which I can get a credit for the roll in the event price poses a threat to the short put ... .


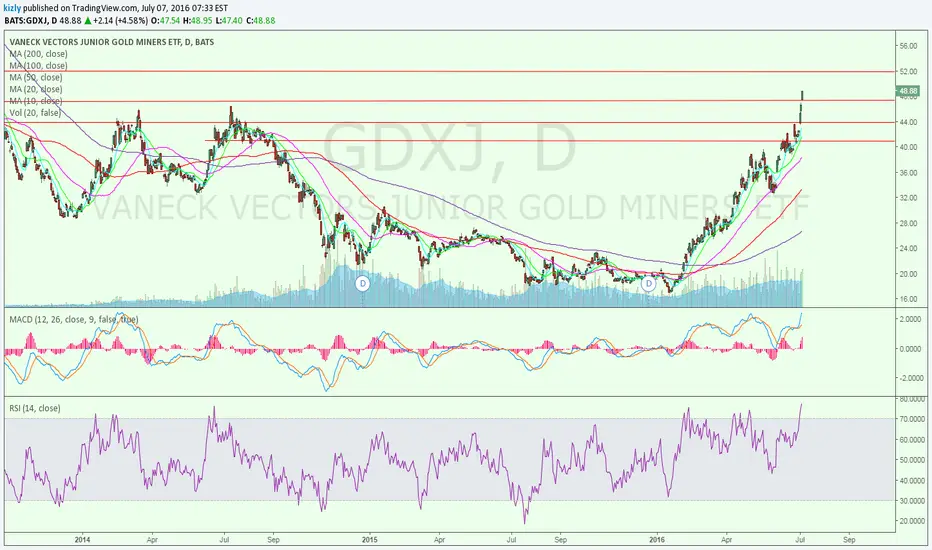
GDXJ - Selling into the breakoutGold price was pulled up on low volume Friday after the NFP data.
A strong NFP data should have caused a steep decline in gold but I think nobody was prepeared for that at Smartmoney.
So what can the banks do in this case? Bullion banks are starting to pull up gold price in the low volume Friday afternoon session. In the gold bull market - and miners bull market - traders get used to buy the dip so they think the rally will last forever. But not this late in the daily cycle and so much stressed above the 200 EMA on the daily chart. Miners are due for a correction and I think we have seen the top in GDXJ and GDX yesterday.
The artificial gold rally on Friday gave the chance to miners to rally higher and banks could sell into this breakout.
I'M looking forward to see a GAP down open in the miners on Monday.

RSI heavlily overbought both GDX and GDXJI might take a risk and buy some JDUST &/or DUST. Gold is still strong bullish so this trade is very risky and I will make final decision when I see gold direction. SL & TP will be determined according to Support and resistance zones. I woild like GDX & GDXJ to go a bit higher in overbought situation and then enter my short.

GDXJSince the Gold obviously started a corrective move down it makes sense to load up with ETF which has also started its corrective move. A lot of supports on the way down present a buying oportunities. My bet would be bellow the red line, which is somewhere between 50% and 61 % fibo lines.
How to trade
1. Wait for a bounce first and then load up
2. If it closes lower than 61 % fibo for 2 consecutive times, negate the trade.
3. Use weekly ATR reading for stops
Regards

gold junior miners etf to buy on gold breakout above cloud 50 mawill run with gold leveraged-get our book on amazon same name money inflows good on all gold related etfs-stop loss 50 ma-stoc crossed-cci and percent r upper range-adx good

Selling 25/45 Strangle in GDXJBecause of high implied volatility, sold a strangle in GDXJ June Expiration.
Sold 25 Put and 45 Call for $51 Credit/contract.
POP: ~90%
BP: ~$400


SOLD GDXJ APRIL 31 23/31 SHORT STRANGLEAs with the XOP play, selling premium where the volatility is and that's in gold issues (GDX, GG, GDXJ) and oil (OIH, XOP) right now.
I filled this earlier today for a $98 credit.
The current metrics are:
Probability of Profit: 72%
Max Profit: $90 per contract
Buying Power Effect: Undefined
Notes: At the suggestion of FractalTrader (that you very much for your ideas, by the way), I'm playing around with what I can do graphically here with options setups, so that it's easier to visualize where price has to "sit" for the duration of the setup.
If you have traded options before, the vast majority of platforms display a range of prices horizontally, with prices below current price on the left, current price in the middle, and prices above current prices on the right, so it's a bit of a challenge to adapt an options platform view (which only consists of a horizontal "price axis") to a candlestick chart.
In any event, this is a short strangle, so I want price to remain between my two short option strikes for the duration of the trade -- above the 23 short put and below the 31 short call ... . I'll look to take the whole setup off at 50% max profit.

