XLU trade ideas

XLU/SPY dont sell yet . is poised to continue and outperformyields of bonds will be even lower, right after the reliefe rally is over.
mabye more QE around the world ?

XLU/SPY Bottom Forming Why would investors search for yield in the Utilities market $XLU ?
Because, they are not able to find it in the broad market.
This chart is very troubling for US Equities.

$XLU Are Utilities Giving Us a Clue to the Broad Market?A break above the black channel could spell trouble for equities.

Bearish bat on XLUXLU is forming bearish BAT pattern. Watch that channel and D-point for possible downward action. Stops above X and no entry if it keep rising or news events disturb it. Targets eg. B-point and C-point or fib. ret. 38,2% and 61,8% of the CD-leg.

MACRO VIEW: XLU STRUGGLING TO GET BACK INTO MACRO UPTRENDSXLU - the SPDR utilities sector ETF is struggling to get back into macro uptrends, while showing no bias on short term.
On long term perspective the price is trading around upper 1st standard deviation from 5-year mean, which is a 5-year uptrend border. The price is also technically in 10-year uptrend, trading above the upper 1st standard deviation from 10-year mean.
Thus one can only say that XLU has restored its long term upward bias if it trades firmly back above 44.
On short term basis price is trading within 1st standard deviation from both 1-year and quarterly mean, showing no directional bias at the moment.

XLU LONGXLU has been one of the strongest sectors over the last month on anticipation of no rate hike.
It is breaking out but is still developing IMO as the rate hike is still in question
moreover it is up against the kumo cloud on the weekly. Resistance area is my target


XLU $44.16: Breaks below triangle support for further downsideXLU broke below a 7-week triangle consolidation support (as shown on the weekly chart), completing a bearish continuation pattern. Further losses risk 43.49 (March 23, 2015 weekly low) then 43.01 (March 9, 2015 weekly low) next. Below there would expose 41.40 (September 22, 2014 higher low). The 45.46 high (April 20, 2015) should cap near term bounces. Only a break above the latter would defer the downside and stabilize for 45.65 (March 16, 2015 high).
Outlook:
Short term: bearish
Long term: neutral

XLU - 10% from 200 SMA (Setup)Set an alert on Daily chart for PPO above 10% on XLU.
Look for a shorting opportunity.

XLU $44.57: Consolidates after falling wedge breakout; Remains nXLU rallied off the 43.02/43.09 minor double bottom to reach 45.63 (March 19. 2015 high) before consolidating. As the indicators are mixed, XLU is expected to remain range-bound near term. Clearing the 45.63 range resistance is needed to turn bullish and confirm basing for a move towards 46.59 initially. Back below 44.02 (March 18, 2015 low) would signal a retest on the 43.02/43.09 recent range support zone.
Outlook:


XLUAfter completing 1.618 and 1.13 Shark target, price was only able to reverse to .382 before reversing again and forming a right shoulder in the process. Extreme ext of Shark is 42.77 and HS tgt 39.76ish


Utilities - An uptrend is an uptrendLooking at the weekly chart, price is standing at value with a very oversold Force Index. The impulse is still red, but the daily chart shows a possible reversal.
On the daily chart, we have a very strong close after a false breakout below the strong support at 45$. There are two ways of making this trade (with my system of course). Either buy now which is perfectly fine or wait for a green impulse on the daily chart. By the time the daily is going to show a green impulse, the weekly impulse would have turned blue, most probably.


XLU Map
I would have thought 50 could retain.
This index is one that makes me cautious on shorts as the final target could be 55 and that can't happen before June.
if 50 retains ok on shorts.

XLU - Utilities - SHORTXLU
1 - Hitting hard in weekly bollinger.
2 - climax style
3 - 5 waves up since july
4 - 21% since july15
5 - Hitting trendline taking all tops in logarithmic since feb10 (115% up since)
These are utlities... They enjoyed better traction in the most defensive part of the rally... it is likely over or close to

Update on $XLU: Prepare to Take Profit and Take it QuickHi Fellow Risk Takers,
Here is a an update on the Long Utilities ETF that I posted a while back.
The information is intended for those who do short to mid term trading and are currently holding long positions on $XLU.
If you have no position and are considering to go long, it might be better to stay on the sidelines and watch.
It might not be a good idea to enter long now, when this update is about taking profit.
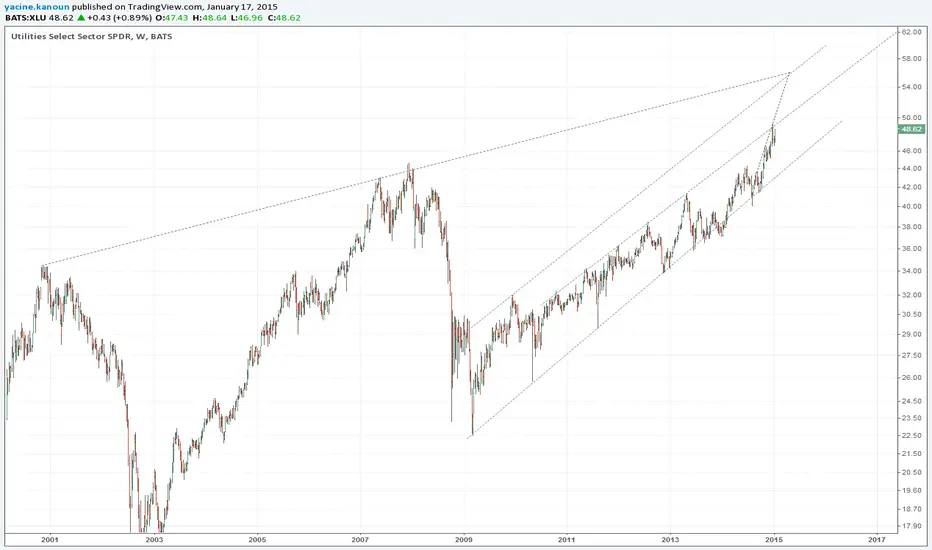
(1) Trend is intact as always and overall environment is bullish.
(2) Price has accelerated above the upper trend channel in (1) and the rise in price is analogous to a vertical takeoff of a space shuttle.
One key characteristic of this accelerated price chart pattern is that the up move is unsustainable.
In other words, price is unlikely to keep on moving higher vertically forever.
Also we can expect sharp sell off the moment price has exhausted upward momentum (Example in Reference section).
Therefore the main idea here is to take profit before sell off.
Simple Profit Taking:
Close position when price is around $50.
Take note that $50 is simply a psychological price level, as human nature have the tendency to place significance to round numbers.
Advanced Profit Taking:
Close position when RSI(14) is about to reach 75.
The main concept is to take profit as close to the Resistance Level of the RSI Oscillator.
Time Limitation:
All long positions should be closed out by 06 Jan 2014, if the $50 or RSi level 75 has not reached by then.
References:
Example of Sharp sell-off After Acceleration: farm4.staticflickr.com
Accelerating Price Chart Pattern> blog.forex4you.com
Using Support and Resistance Levels of Relative Strength Index> Technical Analysis for the Trading Professional by Constance Brown, Chapter 1: Oscillators Do Not Travel between 0 and 100.
Like it, Share it, Follow it~
Trading View: BreakOutArtist
StockTwits: stocktwits.com/BreakOutArtist
Twitter: twitter.com/BrkOutArtist

S&P Sector Review - A Look at Relative PerformanceThe charts above show the performance of each sector relative to all nine sectors combined. XLK tech couldn't be included due to having only 8 panes but it was included in determining the sector ratios. Important to keep in mind that these are ratios, all prices could go lower or higher together but what I'm interested in here is purely the relative performance. Also, in order for one to outperform is ensuring that another sector somewhere is underperforming.
Top Row:
XLU Utilities, XLP Consumer staples, XLF financials and XLV Health are all breaking out on a relative basis. 3 of 4 can be considered defensive sectors. Financials are interesting in that the sector was completely demolished after the 2008 recession and appear to be breaking out of a 5 yr wedge.
Bottom Row:
XLE Energy issues are widely known. Not much to say other then its possible that they go lower longer term and return to previous levels (.10-.12 of the total). The "energy commodities are an asset class" theme may finally be unwound and if so XLE could suffer from underperformance for some time (oversold bounces excluded). XLB materials have not broken down yet but look quite vulnerable. XLY Consumer discretionary did break down and may have recently been saved by the plunge in oil. Any economic weakness and i suspect this will quickly revert and this sector could significantly underperform. XLI Industrials looks like it could break out but has not yet. The transportation portion of this sector has significantly helped this sector.
Summary:
XLU - breaking out upwards, 6 yr wedge
XLP - breaking out upwards, 6 yr wedge
XLF - breaking out upwards, 5 yr wedge
XLV - breaking upper trend line important since 2011
XLE - broke out down, 6 yr wedge, approaching possible long term support
XLB - approaching bottom trend line important since 2002
XLY - broke ascending wedge lower, recently bounced back towards 2013 highs
XLI - sitting at upper trend line that has been important since 2000
XLK - Not shown

