XLU trade ideas


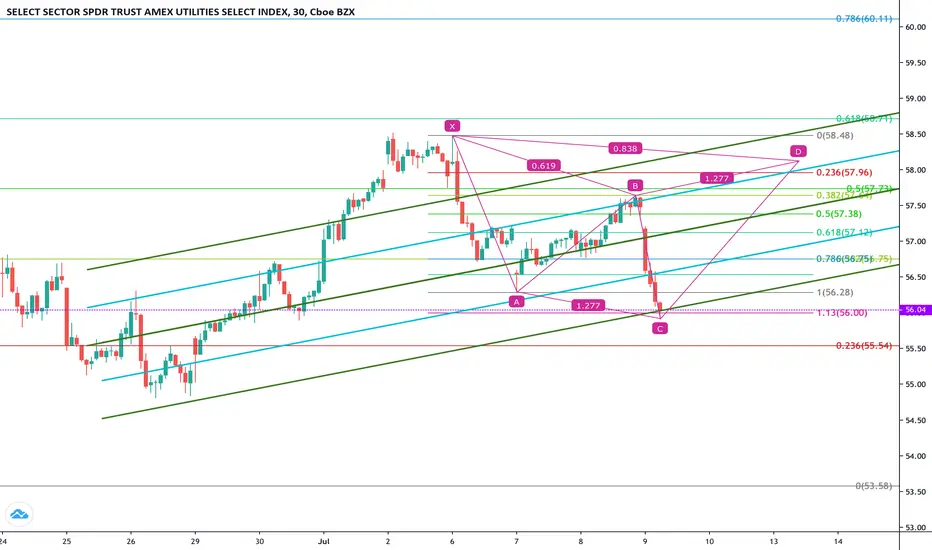


XLU - Symmetrical TriangleLooking for a breakout to the upside.
But it could easily go the other way.
Thoughts?

XLU Position Update: 13:57:15 (UTC) Tue Jun 16, 2020XLU Position Update: 13:57:15 (UTC) Tue Jun 16, 2020


XLU:SPY UpdateI previously made an analysis on this ratio. Here is an update.
Typically the Utilities sector ( XLU ) serves as a hedge in recessionary times. This sector is made up of companies such as water, electricity, natural gas . Companies within this sector usually offer steady and consistent dividends and are less volatile relative to the general market.
The XLU:SPY ratio suggests that when it breaks out above 240-SMA, XLU tends to outperform the SPY . That is what we call RISK-OFF. On the other hand, when it breaks below 240-SMA, SPY tends to perform the XLU. That is what we call RISK-ON.
Currently, the ratio XLU:SPY already tested the 240-SMA and found resistance. I see there was a negative divergence between XLU:SPY ratio and its RSI back in March 2020. Ratio just broke daily uptrend line. My conclusion, we may see higher numbers for the SPY in the following weeks.

XLU - Covering Short at 55.03Looking to cover shorts from 4/27 at 55.03 from entry at 59.9 today.
12:41:48 (UTC)
Mon May 4, 2020

XLU - Short1. Year - outside and down
2. Month - inside month and previous inside month, potential rev strat month.
3. Weekly - outside week and down, near lows of mother bar, Rev Strat week
4. Day - 2 down continuation
5. 60 - scenario 3, outside bar and up, in conflict with TFC. compund 1 inside 5/1's outside bar.
4. Full Time Frame Continuity to the downside. Y,M,W,D
wait for retracement
wait for rev strat to set up, or retracement for entry on the hourly


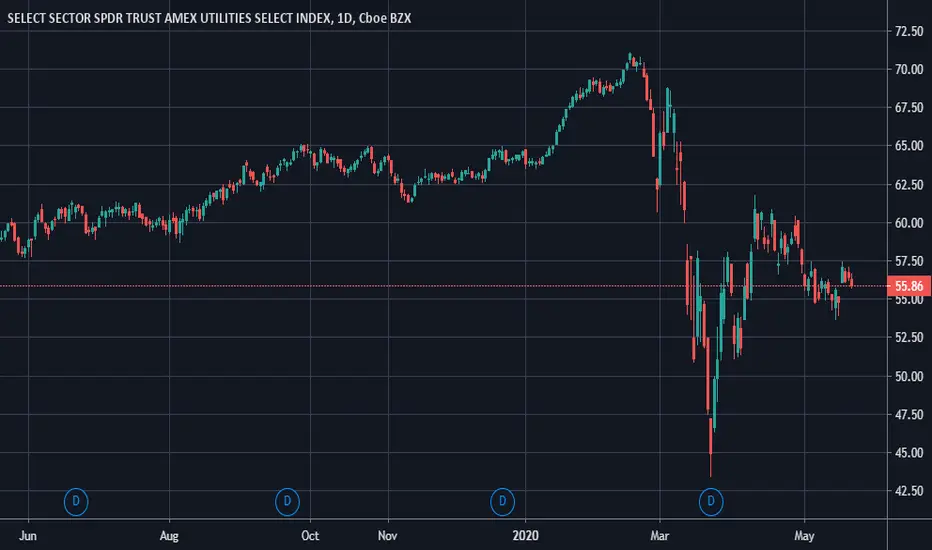
Simple growth chart> head and shoulders crossed and retested TheSimple growth chart> head and shoulders crossed and retested The target is the yellow supply area .

OPENING (IRA): XLU APRIL 17TH/JUNE 19TH 52/50 LADDERED PUTS... for a 2.75 credit.
Notes: Another underlying that has been on my IRA shopping list for a bit. The yield is 2.84% here, but would be better with an acquisition at 52, since the annualized dividend is 1.91 (1.91/52 = 3.67%). Only doing two rungs due to liquidity degrading somewhat as you go out in time.


XLU (NEUTRAL) Daily - sell/buy Range - Thu Apr 9, 2020XLU (NEUTRAL) Daily - sell/buy Range - Thu Apr 9, 2020
12:27:22 (UTC)
Thu Apr 9, 2020

ZLU (Utilities) Daily Bearish Risk Range - Wed Apr 8, 2020ZLU Daily Bearish Risk Range - Wed Apr 8, 2020
13:48:00 (UTC)
Wed Apr 8, 2020
