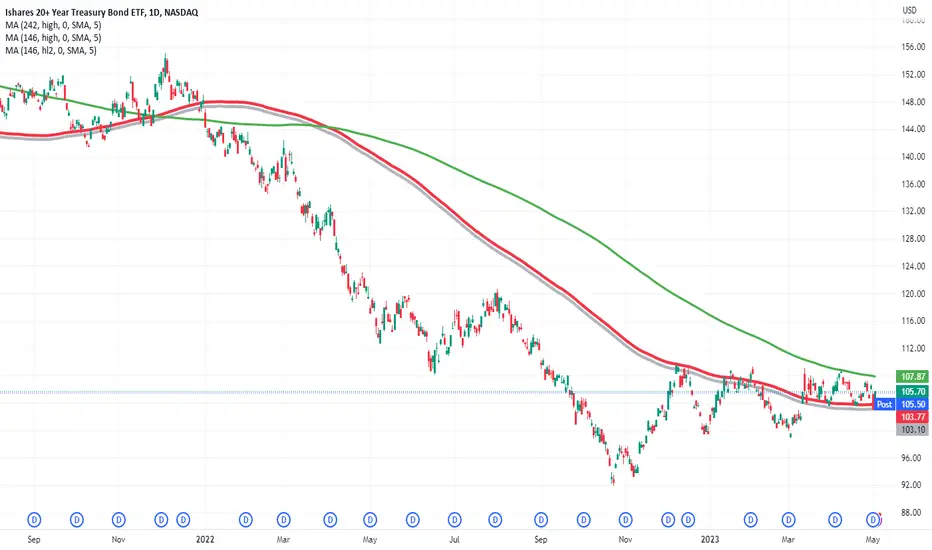
TLT - a long slide and now ???Are we done? Lower long rates with a recession? Or a collapse with default fears or other economic reasoning? I have my MA levels and will wait and watch.
TLT trade ideas
Wave 4 still has the powerThe trend still remains possessed by the triangle in wave 4. FOMC meeting is tomorrow, and waves E of major trends often end on the news.
The news never define the market. Traders wait for the news not to trade the actual statistics or decision, but to see what the others will be doing in response to the news. A few seconds or minutes after the news hit the wire the entire process of "trading the news" gets reduced to simply looking at the charts and trading the structures that have been there since long.
This week the TLT chart should produce a spike towards 108..110, potentially even making a shallow new high, and then the structure will be completed, the triangular wave 4 will end, and wave 5 will begin.
Wave 5 of the sell-off in Treasuries is inevitable, it will bring 10Y to 10%, cause a crash of the Euro to 0.75, and will force SPX to land at 1500. In the next 2-3 months we are going to see an event that never happened in the history of the markets.

Wave 4 is very likely completedThe triangle in wave 4 looks very much completed. It is very likely that wave 5 has already begun, and the final countdown to the crash has started too.
The clock is ticking. By August 23rd (very likely even earlier) the crash will not only begin, but it will already be wrapping up.
SPX will be at 1500 or lower, while 10Y yield will reach 10%.

Long bond TLT looking more and more constructive in this rangeThe TLT has been mostly chopping sideways for the last 4 months, and while it is still directionless, it has been able to stay above it's cycle lows and not roll over to retest them.
This consolidation is looking more and more healthy and if we can finally get some closes above 109, this could finally initiate a second leg higher to those Q2 2022 levels. Started a position here and would add on strength on continuation.

Treasuries update. Wave 4 still in progress.The complete structure of wave 4 will neatly resemble a classic triangle, only wave E will break to new highs.
This is the last attempt of the market to buy the dip in Treasuries. (Also the last attempt of EURJPY to reach a new high - should stop around 157 next week).
After that wave 5 of the downtrend in Treasuries will commence, targeting the peak of the crash in H2'23.

Wave 4 in TLT is almost overI still cannot confirm that the triangle in wave 4 has ended. Triangles take time to develop, but once they are over, wave 5 almost always takes less than 0.618 of the duration of wave 4 to compete.
If W4 ended today, then the crash in Treasuries should end before 23 Aug 2023: by that time we will see 10Y at 10%.

TLT - Dominant is short side, but upside reversal nearbyAbove 105.5 would represent upside reversal. I will watch for it and trade to the long side if it pops.
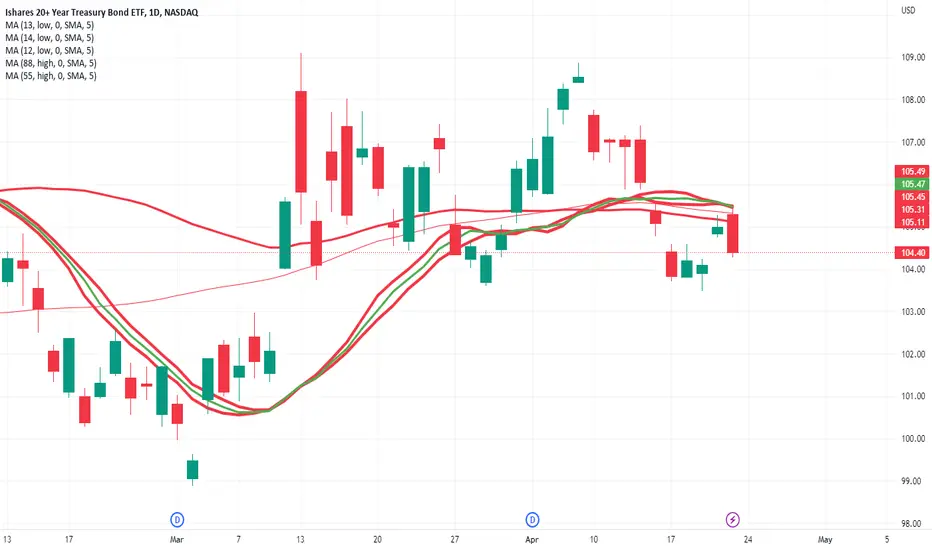
TLT broke the containment MA but the next is the cycle pivotThe 13 day MA of lows in TLT is a great example of a potential cycle pivot. This is the current zero slope MA. After TLT broke the containment MA, this is now a critical MA to watch for possible next move.
Are Rising Rates in Store? 🏠📈🔥Trending Mortgage Interest Rates Video🔥: Expert Analysis by Las Vegas Mortgage Broker Andrew Leavitt - Are Rising Rates in Store? 🏠📈
Stay ahead in the game with Andrew Leavitt, a leading Las Vegas Mortgage Broker, as he provides expert trend analysis on mortgage interest rates! Unveil the market's direction: rising interest rates or something else? Don't miss it! 🚀
If you're a Las Vegas homeowner or aspiring homebuyer, this in-depth analysis of mortgage interest rates is essential for your financial planning! 🎯
🌟 Key Phrases: Las Vegas Mortgage Broker, Mortgage Interest Rates, Rising Interest Rates, Rising Rates, VA Loan Las Vegas, FHA Loan Las Vegas 🌟
Discover the factors impacting mortgage interest rates in this comprehensive video. Whether you're considering a VA Loan Las Vegas or an FHA Loan Las Vegas, understanding these trends is crucial for making informed decisions. 💸
Join Andrew Leavitt, our Capital Markets Head, as he examines mortgage interest rate trends and anticipates their future direction. Will the market face rising interest rates or witness a new trend? 🤔
Andrew Leavitt, a renowned Las Vegas Mortgage Broker and Secondary Markets specialist, holds the position of Vice President of Secondary and Systems at Pinnacle Lending Group. With extensive industry experience, he's the go-to expert for navigating the complexities of mortgage interest rates and making sound financial choices. 💼
Don't miss this vital information! Watch the video now and stay ahead of the curve with expert guidance on mortgage interest rates! 🔔
🔑 SEO Phrases: Las Vegas Mortgage Broker, Mortgage Interest Rates, Rising Interest Rates, Rising Rates, VA Loan Las Vegas, FHA Loan Las Vegas, Andrew Levitt, Pinnacle Lending Group, Secondary Markets 🔑

TLT - is this the low?4 days under the 4 day MA of medians. This to me is a very compelling level for a long and or when/if TLT breaks up through it.

TLT oversold presents an opportunity7 days below the 4 day MA of highs. 3 days below the 3 day MA of medians. I'd be long on a higher high.

TLT back to 100Hard rejection from 109 last week and weekly 50sma.
Entry - below Daily 50sma at 104.50 (Purple line)
Stop loss - 200sma or 106


TLT | Inverse Head & Shoulders | LONGThe fund will invest at least 80% of its assets in the component securities of the underlying index, and it will invest at least 90% of its assets in U.S. Treasury securities that the advisor believes will help the fund track the underlying index. The underlying index measures the performance of public obligations of the U.S. Treasury that have a remaining maturity greater than or equal to twenty years.

TLT H4 109/110 To Break On Next Test Targeting 116In this update we review the recent price action in #TLT and identify the next high probability trading opportunity and price objectives to target

How I will profit from a major global recession with this tradeIn my opinion, the global economy is heading into dark times. I have revised my initial position of shorting equities to a much smaller position and instead will be going long government credit via TLT. What's nice about this speculation is it pays you to own it vs the other option of shorting equities.
The banking crisis has shown the cracks in the global economy. Not just in the US but globally. Yield curves from Germany to Canada are completely inverted. Typically liquidity is in the highest demand during the Spring and Fall. I expect this trade to pay off in late Q3 or Q4 of this year. The yield curve does NOT lie! It is predicting a major US recession. What we just saw with the regional banks in the US and Credit Suisse is just the start. During that crisis, we once again saw how bonds were massively in demand as people scrambled to get liquidity through safe assets.
There is nothing more technical about this trade than support and resistance and price action. This is a fundamental trade. A trade that I will be extremely aggressive with on my sizing as I believe the probabilities are very high.

TLT 4 TH WAVE TRIANGLE ENDING DOWNSIDE 85Iam posting the chart as a new Warning to All traders I see this as nearing it s end . I will state if this wave structure turns down from the time window we are entering into my panic cycle May panic and panic low june 16 to the 23 th 2023 is the next spiral as stated jan 20th 2023 forecast . the Importance of the march 13 /23 spirals back to june 13th 1949 plus the other 3 spirals are a cluster at each cluster of spirals events have occurred MARCH 13 2023 AUGUST 16TH 2022 OCT 13TH 2022 SEPT 6TH 2021 AND MY MARCH 18TH TO THE 21 ST 2020 . .BEST OF TRADES WAVETIMER !!!

Treasuries 2023 updated outookWave 5 is inevitable, only its time of flight is unknown. In a well-structured trend (and we have a perfect trend here), the time spent between points 3 and 5 is loosely related to the duration of 1-3.
I have seen waves 5 hit top/bottom at 0.5..0.786 of this ratio. It's never a precise fib number, but 3-5 does tend to be faster than 1-3. Based on these observations, here we have out timing estimates for w5 completion:
0.382 - June 6 (too fast.. 0.382 ratios are rare, but still possible)
0.5 - August 15
0.618 - October 23
0.786 - January 31, 2024
So, realistically, we are going to see Treasuries bottom out in September-October. By that time the market will achieve the "impossible four":
- 10Y paper will hit >10%
- SPX at 1500
- EURUSD at 0.75
- USDJPY at 100

Bonds near reverting its downtrend, $TLTThe 20-year bonds ETF is near a key breakout level that should confirm a new uptrend in bonds.
This should be followed by a breakout above 4,100 in the SP:SPX .
Just look a the bullish divergence between the MACD and the price of NASDAQ:TLT , its a very good signal.
Let's wait for the breakout and follow through.

% BONDS & INTEREST RATESThere's obviously lots of discussion about interest rates and where they are headed. Today, I'm going to look at long-term interest rates based on the well-known ETF: $TLT . Long-term interest rates are useful as a guide for most people who get a home-loan or longer-dated loans and is usually less prone to manipulation (by Central Banks) than short-term rates.
Bond prices move inverse to interest rates. A rise in bond price means a lower interest rate and vice versa.
📈📉 Let's have a look at the long-term chart. I'm using the weekly timeframe to remove the day-to-day noise.
You can see that since the January 2020 peak, bond prices have fallen. This was when interest rates bottomed and started rising. The bear market in bonds extended to Oct 2022. Subsequently, we have seen a rally in bonds and therefore a drop in interest rates.
The multi-trillion dollar question is: Was Oct 2022 the BOTTOM i.e. has interest rates peaked?
My technical view is that the bearish trend in bonds is still the dominant force. So far the bounce off the bottom does not yet signal a trend reversal. For this to be the case, I need to see TLT move higher beyond 114.
IF price moves beyond 114, I would be more confident in stating that at a minimum there has been a Change in Behaviour. At that price level, the size of the upward move would be the largest since the Jan 2020 top. Larger than the upward bounce that began in Mar 2021 and ended in Nov 2021.
A Change of Behaviour signals that market participants are starting to have differing opinions. It is this change in opinion that sow the seeds as the first step required for a trend change.
If the bond price falters prior to reaching beyond 114, it is highly likely that we have not seen the bottom and higher interest rates should be expected.
Clearly the next few weeks will be crucial in that determination. I will update my thoughts as the price evolves.

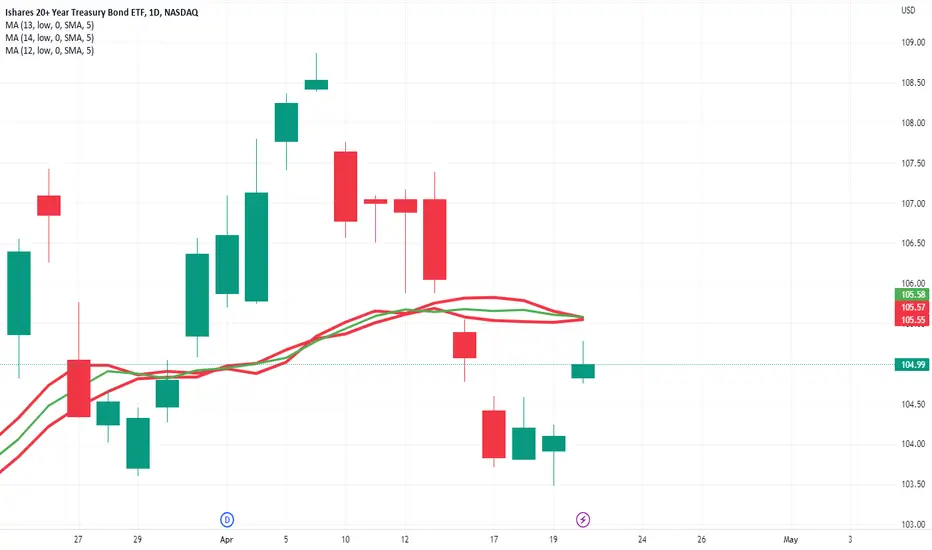
TLTFlagging here..
Breakout over 107
Target 110.
If it rejects, then a pullback to 102 or trendline support.

Zoom out and use what you know to make forward predictionsTLT is a precise instrument.
Weekly rarely leaves a gap behind, and if it did, it was a big move up or down.
It's the most forward looking.
Take for example Jan 1st 2020.
What you will notice is a consolidation at the 200W and a move higher the week after the JHEQX pin.
That move was a clear pivotal forward indication the market was going to crash in Mar 2020.
Now look at the week the fed began QE on Mar 16th.
This QE opened pandoras box of crypto, meme stocks, penny pumps, SPACS, and speculation nation that was 2020-2021.
Now that bonds have been decimated for over a year we are at a pivotal point.
JHEQX is set to expire today releasing a pin in equity hedging allowing markets to make their next move.
My plan the next month is to find a suitable long TLT position for 2025 leaps.
There are 2 gaps above in TLT weekly as a result of 2 major JHEQX pin weeks.
There could still be a drop in TLT the next few months if markets & banks hold strong in Q2 and fed remains hawkish into next hike.
A selloff in TLT next week (rates up) would most likely mark the bottom.
2020-2021 was an exceptional year.
So far the recovery starting in 2022 to now has had its share of exceptional sell off moments and capitulations witnessed for the Sept'22 CPI print.

TLT Volume Spikes UPDATED with ElliotwaveTLT Volume spikes prior to peak, when the fed first started raising rates. Now a volume peak right when the fed has said they will consider a pause for the next meeting. This could mean that the market thinks that rates are going to come down, and that therefore the value of long term bond assets will go up, as well as the value of banking stocks which are currently underwater. Previously, I mentioned that I though that the TLT would be going down, now I am updating this idea to include the notion that the fed may be done hiking for the short to long term, and that the TLT will be going up after experiencing large volume after a down trend.
