Robinhood - The third bearish crackdown!🏹Robinhood ( NASDAQ:HOOD ) will crash quite soon:
🔎Analysis summary:
Since we witnessed a major botton on Robinhood in 2023, this stock has been rallying about +1,600%. But always after a major +250% rally, Robinhood corrected at least -40%. Therefore it is quite likely that we will see anoth
Next report date
—
Report period
—
EPS estimate
—
Revenue estimate
—
2.48 USD
1.41 B USD
2.98 B USD
758.58 M
About Robinhood Markets, Inc.
Sector
Industry
CEO
Vladimir Tenev
Website
Headquarters
Menlo Park
Founded
2013
ISIN
US7707001027
FIGI
BBG008NMBXN8
Robinhood Markets, Inc is a financial services platform, which engages in the provision of retail brokerage and offers trading in U.S. listed stocks and Exchange Traded Funds, related options, and cryptocurrency trading, as well as cash management, which includes debit cards services. The company was founded by Vladimir Tenev and Baiju Prafulkumar Bhatt in 2013 and is headquartered in Menlo Park, CA.
Related stocks

Is this the dip $HOOD bulls have been looking for?Is this the dip NASDAQ:HOOD bulls have been looking for?
Based on this company's financial technology innovation and the fact that they have 11 business lines that generated over $100M in annualized revenue, I am bullish on HOOD's future stock price trajectory.
After a great rally, HOOD has pull

HOOD & ROBN in BUY ZONEMy trading plan is very simple.
I buy or sell when at either of these events happen:
* Price tags the top or bottom of parallel channel zones
* Money flow volume spikes beyond it's Bollinger Bands
So...
Here's why I'm picking this symbol to do the thing.
Price in buying zone at bottom of channe

ROBINHOOD HOOD Bearish Playbook — Thief on Duty!📉 ROBINHOOD MARKETS INC. (HOOD) — Bearish Profit Playbook
🔥 Swing / Day-Trade Thesis with Thief Layer Strategy
🧭 Market Context & Core Idea
The bearish outlook is confirmed after HULL Moving Average shows a downside breakout, signaling momentum shifting toward sellers. This forms the backbone of t

HOOD Weekly Analysis – Past 6 months dataTicker: HOOD
POC = $99-$101
POE1 = $104 - $105.50
POE2 = $114.50 - $116
Plan: Buy if Monday closes with a green candle and high volume.

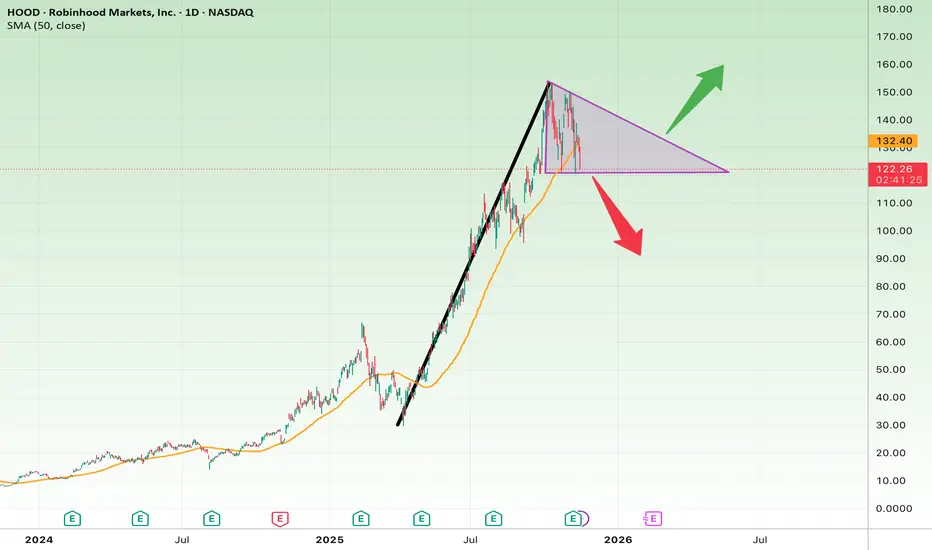
Robinhood at a Major TriangleHOOD formed a symmetrical triangle after a massive rally from ~$20 to ~$150. This consolidation now acts as a make-or-break zone.
Bullish Case:
• Break above $140 → continuation toward $160–$170
• Supported by the 50-day SMA at $111
Bearish Case:
• Drop below $120 → correction to $100–$85
HOOD 1M AI Analysis – Neutral Trend🚀 HOOD – QuantSignals AI Analysis (1M Prediction)
Current Price: $133.27
Final Prediction: $133.08 (-0.14%)
30min Target: $132.79 (-0.36%)
Trend: Neutral
Confidence: 55%
Volatility: 32.2%
Summary:
1 stock analyzed (HOOD)
0 trade signals generated
The Market shows a neutral trend for HOOD in

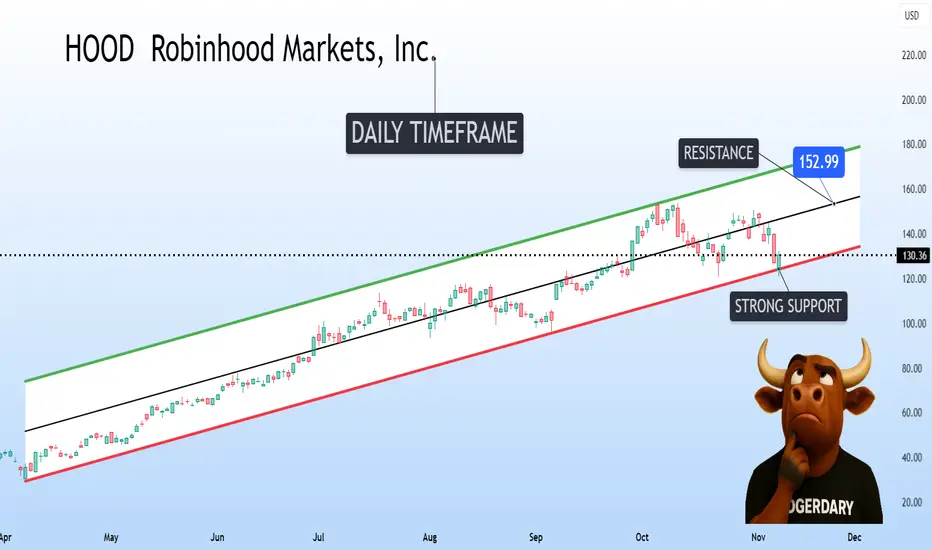
Robinhood is bouncing from the bottom of the channelRobinhood Markets NASDAQ:HOOD is 𝗯𝗼𝘂𝗻𝗰𝗶𝗻𝗴 𝗳𝗿𝗼𝗺 𝘁𝗵𝗲 𝗯𝗼𝘁𝘁𝗼𝗺 𝘀𝘂𝗽𝗽𝗼𝗿𝘁 𝗼𝗳 𝗶𝘁𝘀 𝗮𝘀𝗰𝗲𝗻𝗱𝗶𝗻𝗴 𝗰𝗵𝗮𝗻𝗻𝗲𝗹 on the daily timeframe.
This zone has consistently acted as strong support since April, and bulls are showing signs of defending it once again.
If momentum continues, 𝘁𝗵𝗲 𝗻𝗲𝘅𝘁 𝘁𝗮𝗿𝗴𝗲𝘁 𝗰𝗼𝘂𝗹𝗱 𝗯𝗲 𝘁𝗵𝗲 𝗺𝗶𝗱-𝗿𝗮𝗻𝗴𝗲
Hood techincal support I see exhaustion of sales in the stock, possible buying opportunity, as it is in the balance of the structure.

Robinhood (HOOD) | Explosive Q3 & Bullish Setup📊 Fundamental Highlights – Q3 2025
Robinhood NASDAQ:HOOD just posted blowout earnings for Q3:
🔼 Revenue up 100% YoY to $1.27B
💥 EPS up 259% YoY
📈 Total platform assets surged 119% to $333B
💸 Transaction-based revenues +129%, led by crypto, options & equities
💰 Net interest income +66% to $456M
🏦

See all ideas
An aggregate view of professional's ratings.
Neutral
SellBuy
Strong sellStrong buy
Strong sellSellNeutralBuyStrong buy
Neutral
SellBuy
Strong sellStrong buy
Strong sellSellNeutralBuyStrong buy
Neutral
SellBuy
Strong sellStrong buy
Strong sellSellNeutralBuyStrong buy
Displays a symbol's price movements over previous years to identify recurring trends.
Curated watchlists where HOOD is featured.


Frequently Asked Questions
Depending on the exchange, the stock ticker may vary. For instance, on BOATS exchange Robinhood Markets, Inc. stocks are traded under the ticker HOOD.
We've gathered analysts' opinions on Robinhood Markets, Inc. future price: according to them, HOOD price has a max estimate of 180.00 USD and a min estimate of 86.00 USD. Watch HOOD chart and read a more detailed Robinhood Markets, Inc. stock forecast: see what analysts think of Robinhood Markets, Inc. and suggest that you do with its stocks.
HOOD reached its all-time high on Oct 6, 2025 with the price of 154.17 USD, and its all-time low was 7.28 USD and was reached on Jun 21, 2022. View more price dynamics on HOOD chart.
See other stocks reaching their highest and lowest prices.
See other stocks reaching their highest and lowest prices.
Yes, you can track Robinhood Markets, Inc. financials in yearly and quarterly reports right on TradingView.
Robinhood Markets, Inc. is going to release the next earnings report on Feb 18, 2026. Keep track of upcoming events with our Earnings Calendar.
HOOD earnings for the last quarter are 0.61 USD per share, whereas the estimation was 0.54 USD resulting in a 13.36% surprise. The estimated earnings for the next quarter are 0.59 USD per share. See more details about Robinhood Markets, Inc. earnings.
Robinhood Markets, Inc. revenue for the last quarter amounts to 1.27 B USD, despite the estimated figure of 1.21 B USD. In the next quarter, revenue is expected to reach 1.34 B USD.
HOOD net income for the last quarter is 556.00 M USD, while the quarter before that showed 386.00 M USD of net income which accounts for 44.04% change. Track more Robinhood Markets, Inc. financial stats to get the full picture.
No, HOOD doesn't pay any dividends to its shareholders. But don't worry, we've prepared a list of high-dividend stocks for you.
As of Nov 22, 2025, the company has 2.3 K employees. See our rating of the largest employees — is Robinhood Markets, Inc. on this list?
EBITDA measures a company's operating performance, its growth signifies an improvement in the efficiency of a company. Robinhood Markets, Inc. EBITDA is 2.11 B USD, and current EBITDA margin is 38.82%. See more stats in Robinhood Markets, Inc. financial statements.
Like other stocks, HOOD shares are traded on stock exchanges, e.g. Nasdaq, Nyse, Euronext, and the easiest way to buy them is through an online stock broker. To do this, you need to open an account and follow a broker's procedures, then start trading. You can trade Robinhood Markets, Inc. stock right from TradingView charts — choose your broker and connect to your account.