BTC to retest support at 67kAfter the completion of the 5th EW and then the immediate dump off of 72k resistance, I expect the pattern to continue and complete the final c off of 67k support. If it breaks this support I expect it to fall back down to the next support of 65k with a strong bounce
BTCUSD.P trade ideas

probably nothing...Short time !
Je pense que nous sommes en train d'aller vers les 54000$ avant de repartir à la longue hausse !

BTCBTC and potencial Bearish Retracement into D Discount / W FVG from there price can react and make All Time High


BTC near term downsideI expect CRYPTOCAP:BTC to touch $68,300 before resuming uptrend and retesting $73K.

BTC forecast for JulyMost likely, a weak downward movement will continue to the border of the formed flag/wedge. And it makes sense to buy at its lower limit. If before this time its upper limit of 72-74 is broken, of course you can also buy BTC

Jun.4-Jun.10(BTC)Weekly market recapEmployment data was released last Friday. Although the unemployment rate rose to 4%, the number of NFP exceeded expectations, reaching 272,000. The data performed average, but due to market expectations were too high, there was a correction after the data was released. Not only in crypto, gold has also seen a obvious correction.
The market currently predicts that the number of interest rate cuts in 2024 will be reduced to two times, in September and December. The CPI and FOMC for May will be announced on Wednesday and Thursday this week. We believe this will determine the medium-term trend. Regardless, we are heading towards a rate cut.
BTC is as we predicted last time, after rising and falling. It is slightly lower than last week’s price. Although the price has corrected, there has been no continuous decline for the time being. Trading volume is low. From the WTA indicator, after the last analysis released, a small number of blue columns representing whales appeared, but they quickly disappeared. The ME indicator continues to maintain a bullish trend.
To sum up, we believe that the volatility of BTC will increase this week and continue to fluctuate, with the probability of rising higher than falling. We maintain our original resistance level 74000 and support level 61000.
Disclaimer: Nothing in the script constitutes investment advice. The script objectively expounded the market situation and should not be construed as an offer to sell or an invitation to buy any cryptocurrencies.
Any decisions made based on the information contained in the script are your sole responsibility. Any investments made or to be made shall be with your independent analyses based on your financial situation and objectives.

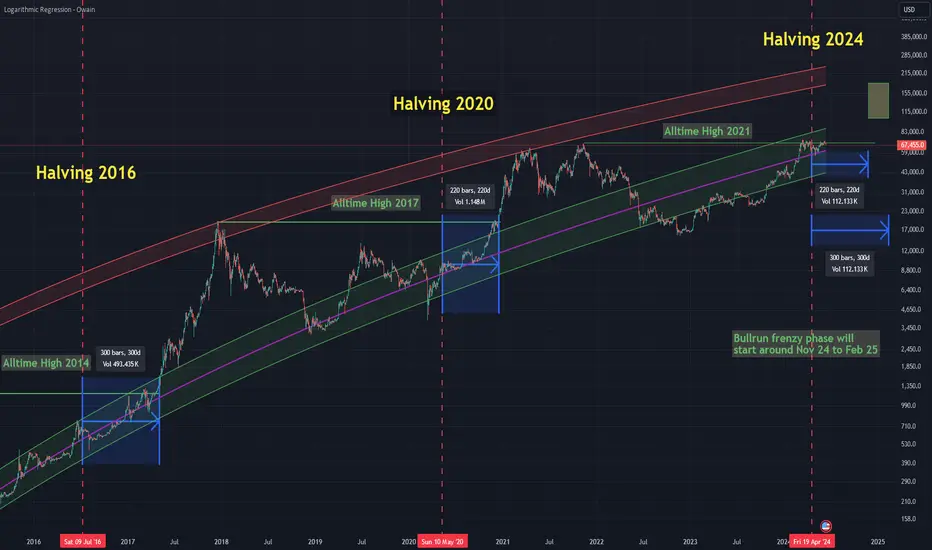
Bitcoin not due yet to go into full degen bull market modeIf history repeats itself - and so far history has repeated itself for Bitcoin every 4 years, we have not seen the true face of the Bitcoin bull market yet.
Let's have a closer look at where and when things could really go ballistic to the upside by analysing its so-called logarithmic regression:
You will see 3 different areas of importance on this chart:
1. A purple line showing the current "fair" price of Bitcoin according to the regression
2. A green channel marking the price area where Bitcoin should spend most of its time
3. A red channel marking the projected blow off tops for each bull run
The pattern we usually see is that after a top somewhere within the red channel Bitcoin eventually falls back to the green channel (and sometimes below it) to then settle roughly around the purple line at the time of the halvings.
What do these findings tell us about the current state of the bull market?
Let's look at the price behaviour after the halving of 2016 and 2020.... It took Bitcoin around 300 days after the 2016 halving and 220 days after the 2020 halving to finally breach the green channel to the upside and go into, what I call, full degen frenzy bull market mode. This is the area between the green and red channel, where prices go ballistic and influencers on social media will talk about the how everything will be different this time and how everything is only going up from now on.
As you can see Bitcoin currently is still quite far away from leaving the green channel to the upside. In fact if it would go into full frenzy bull market mode right now we would need to see prices well above 90,000 USD. If history repeats itself again and we can expect the price to leave the green channel to the north sometime 220 to 300 days after the halving. That would be sometime between November 2024 and February 2025 - the top of the green channel will then be around 100,000 USD.
Price will then probably rise rather quickly to the red channel again where it will eventually top out and, once again, enter a bear market. Top prices should be somewhere between 200,000 USD and 300,000 USD in 2025. It is then time to get out of the market and go into hibernation once again to come back once the lower green band of the logarithmic regression is reached.
The good news is....with prices currently around 67,500 USD there is still plenty of money to earn even until reaching the phase where the price of Bitcoin will really go ballistic. The bad news is... most people will be left behind and will probably fomo into Bitcoin (or the worse alternative: Altcoins) at prices between 150,000 USD and 200,000 USD.
This, of course, is just my own opinion and no financial advise!
Volume is back ... BTC heading toward 67k supoort Volume on BTC has finally returned. Heading into FOMC on Wed, will we see a bounce off of 67k, or will we test lower ...
RSI on the 4hr is tapping 30. On the daily its pushing below 50. Heat maps suggest a liquidation cascade below 67k. Bulls will need to wake up soon and put up a serious fight in order to retest the 72k level.
As the saying goes, this will be the most important CPI and FOMC of our lives, until the next one

Bitcoin facing a dangerous rejection- follow up analysis on this:
- looking pretty clear that I was wrong and Bitcoin is not ready to move to the upside
- with another rejection at the 72k level however odds of a substantial reversal have increased heavily
- clear trend present for the last 2 months: Mondays have either been the low (green) or, more commonly, the high of the week (meaning price did not trade above the Monday high for the rest of the week)
- we got another high of the week print yesterday

RIP listen to youtuber lolWill BTC go 100k? for sure, it could but looking at all the charts do you want to take the risk?
You have missed the boat, it is alright. They are taking profit and you are buying the top.
What if you missed the boat? Why do you bother? Money will go from the patient hand to the impatient hand.
Why can't you just wait till indicators long-term are showing oversold?
Do you know what I am doing right now? Buy some good projects that are undervalued and it drop about 80 to 90% and stake it. ( Remember only risk 20% )
And staked your stable coin to earn APR. When indicators weekly and monthly show oversold, this is the time you need to start deploying your 80% cash.
That time BTC bottom may be 100k or 150k, you don't have to bother coz you just need to respect the charts and indicators and you know that you don't buy the top. Don't FOMO in.
Imagine you staked a stable coin and earned 5% APR. By the time, indicators show a market bottom, you have a large some of cash to deploy. Anyway, your money your decision. hahah

Bitcoin BTC to $250K - BUY & HODLBitcoin went to the Moon with Dec '17 top.
Then it corrected 88.6% on the Fibonacci Retracement with Dec '18 bottom.
After that it went to Mars and hit the tops again in Nov '21.
It was a 2000% gain.
What can you tell from this?
Percentage-wise, Correction is lower than the gain.
So, the Dominant Trend for BTCUSD is UP!
OK, back to Earth.
Let's gather fuel and power-up the rocket.
Time to go Interstellar.
Before I go into the technical stuff, allow me to keep things simple for you.
I took the liberty and measured the BTC Cycles.
But you don't need to worry about that, just follow my lead!
I used a fancy tool called Fibonacci Time Zones.
This tells me roughly when the next Bullish Cycle for Bitcoin will start.
We are on the 5th Fibonacci Summation milestone, and another 2000% gain is destined to commence.
When?
Early '23 , like all other Cryptocurrencies.
What's the level?
My ultimate levels are: 10K & 7.5K .
I will buy more there.
I will HODL for the long-term because I know it's a waiting game.
Now you have what you came for: when & where.
You can go ahead and open the next idea. :)
Thank you and you're welcome.
But if you capable of digesting what's to come below, then I put my hat down...
Bitcoin ( BTCUSD , BTCUSDT , BTCBUSD ) Technical Analysis:
* Elliott Wave Cycle: Complete V Cycle Degree (white)
* A-B-C Elliott Wave Correction (red)
* Ending Diagonal in Cycle C (red)
* Harmonic Pattern: Cypher
* 88.6% Fibonacci Retracement
* 161.8% (Golden Ratio) Fibonacci Extension
* Bullish Divergence
* Dominant Trend Line (turquoise dotted)
* Demand Zone
* Fractal Pattern
If you get all this without a headache then you're a legend!
The Aug '15 to Dec '17 is what I'm expecting, and it's a BIG one.
Good luck my fellow HODLer..
Thanks for the like,
Richard, the Wave Jedi.

We will never go bellow 40k again.Link the lines with bottoms to the tops. It shows that under 40K not possible to be the price of BTC anymore.

Is BTC going through Wycoff Distribution?Looks like BTC is going through a Wycoff distribution on the daily.
Will be looking to fill up on some shorts on the UTAD
Could this lead to the break down lower for more accumulation before the blow off top
Just the thoughts of a average degen trader,

BTC WEEKLY MACD CROSSEvery time the MACD crosses down, price reverts back to the 200 SMA IN IT'S HISTORY.
BTC Weekly MACD signal cross

||BTCUSD|| SET TO REACH 80K IN THE NEXT MOVE!We are currently sitting in an interesting situation regarding market structure. Two bullish formations have been printed after the price broke out of the current flag formation, only to create one of the shoulders for the H&S formation as depicted in yellow.
Two formations intertwined so perfectly is normally a great sign for the direction the formations dictate, as you are strengthening retail confidence, and bringing 2 groups of strategies together with a bullish sentiment.
in order to be confident prices are to reach our targets, price must break the 71.6K mark and at least test it once. price does of course have to exceed all time highs of 73.9K which will be the last level of resistance before we move back into price discovery mode. I do not think the ATH will post much resistance based on the strength of current market structure.
The MACD is also priming itself for a convergence run once averages break apart as they have been in consolidation for a couple days.
Although my targets are set for both 81K and 87K I do expect price to get stuck once it reaches 80K as it does pose a strong psychological level of resistance.
Thank you for your read, hope you found some new insights and perceptions on the BTC market structure.

Investment and Hedging Strategies in the Bitcoin MarketRecently, Bitcoin has experienced significant volatility, sharply declining after the flash crash on June 6. Prices fell from the $72,000 level to below $70,000, leading to substantial selling pressure. However, positive trends can be seen in the market as U.S. ETF issuers are buying a lot of Bitcoin, which boosts confidence in the long-term outlook of the cryptocurrency.
Key Points:
Strong Support at $66,000: Breaking this level may indicate a shift in the downward direction.
Resistance at $74,000: Surpassing this level could drive prices to new highs.
ETF Purchase Volume: Adding 25,729 bitcoins in the first week of June enhances confidence in the long-term upward trend.
Recommendation:
For Short-Term Investors:
Due to high volatility and current selling pressure, it is advisable to wait and see if the support at $66,000 holds. If the support level is broken, it may be wise to avoid entering the market until prices stabilize.
For Long-Term Investors:
Price corrections can be used as opportunities to add more Bitcoin to investment portfolios. It is smart to invest gradually and take advantage of price drops to make purchases.
Hedging Strategies:
Diversification: Diversification is a hedging strategy aimed at reducing risk by spreading investments across various assets. Instead of relying solely on Bitcoin, investors can diversify their investments into other digital assets like Ethereum, Litecoin, or even traditional assets like stocks and bonds. This diversification can reduce the negative impact of Bitcoin’s volatility on the overall portfolio.
Futures Hedging: Futures hedging involves buying or selling Bitcoin futures contracts to protect the portfolio from price fluctuations. If an investor owns Bitcoin and wants to protect against price drops, they can sell Bitcoin futures. On the other hand, if they expect prices to rise but do not own Bitcoin, they can buy futures to benefit from the expected increase.
Risks Associated with Hedging Strategies:
High Costs: Hedging with futures involves paying fees and spreads, increasing overall costs.
Systemic Risks: Futures contracts can be affected by economic and political events, leading to unexpected losses.
Technical Knowledge: Hedging with futures requires a deep understanding of the markets and how futures contracts work.
Hedging strategies provide protection against market volatility but must be used carefully and with a clear understanding of the potential risks.
Diversification and futures hedging can be effective tools for risk reduction, but it is essential to understand the costs and risks associated with these strategies before implementation.

Bitcoin Analysis SIMPLEST WAYNow BTC breakout falling wedge pattern, and its buy time. Many patterns formed in 1 hour time frame. BTC still inside the Channel pattern.

Bitcoin's Stalled Breakout: A Test of Bullish Resolve
Bitcoin (BTC) ended last week with a whimper, failing to decisively break out of a bullish technical pattern and overcome key resistance levels. This has left many investors questioning the short-term trajectory of the world's leading cryptocurrency. After a price drop on Friday and a lackluster weekend, what can we expect from Bitcoin in the coming days and weeks?
The Failed Breakout and Bullish Doubts
The recent price action centered around a prominent technical pattern known as a bull flag. This pattern typically precedes a bullish continuation, with a price consolidation period following an uptrend. However, Bitcoin's attempt to break above the flag's resistance level at the end of the week proved unsuccessful. This failed breakout has cast doubt on the immediate bullish momentum and raised concerns about a potential reversal.
Technical Indicators: A Mixed Bag
Adding to the uncertainty are technical indicators that paint a conflicting picture. Some, like the Relative Strength Index (RSI), are hovering around neutral territory, suggesting neither overbought nor oversold conditions. This could be interpreted as a sign of potential buying pressure waiting to be unleashed.
However, other indicators like the "death cross" – formed when the 50-day moving average dips below the 200-day moving average – have emerged, historically hinting at a possible short-term price decline.
The ETF Inflow vs. Hedge Fund Shorting Tug-of-War
Beyond technicals, a fascinating dynamic is playing out between two opposing forces in the market: inflows into Bitcoin Exchange-Traded Funds (ETFs) and short positions taken by hedge funds.
On the bullish side, significant inflows into Bitcoin ETFs have been observed. This suggests institutional interest in the cryptocurrency remains strong, potentially providing a buying force that could propel the price upwards.
However, this optimism is countered by reports of hedge funds taking large short positions on Bitcoin. These bets essentially profit if the price falls. This shorting activity could act as a headwind, potentially hindering any significant price gains.
Short-Term Bounce vs. Long-Term Trend
While a short-term bounce from current levels seems likely, predicting the long-term direction of Bitcoin remains a challenge. The failed breakout and bearish technical indicators raise concerns about a potential downward correction. However, the underlying fundamentals, including strong institutional interest and Bitcoin's limited supply, suggest long-term bullish potential.
The Bottom Line: Patience and a Multifaceted Approach
For investors, the current situation necessitates a patient and multifaceted approach. Monitoring both technical indicators and on-chain data to gauge investor sentiment can provide valuable insights. Additionally, staying informed about regulatory developments and broader market trends is crucial, as these external factors can significantly influence Bitcoin's price.
Ultimately, while the immediate future of Bitcoin is uncertain, one thing remains clear: the battle between bulls and bears is far from over. The coming weeks will be telling, revealing whether Bitcoin can gather enough strength to overcome the recent setbacks and continue its upward trajectory.

Interesting Bitcoin chartWhy currently is bitcoin volume decreasing? Mostly happens at the top of a cycle. Last time this happened mid cycle there soon after bitcoin had a 38% shakeout.
I imagine that for BTC to achieve the price highs in which people hope for its only inevitable now that it breaks its long term divergence with the top indicator.
Be interesting to see how this plays out.

BTC Bitcoin Long- 4 Confirmations R:R 1:2 Part 1BTC Bitcoin LONG- decided upon four confirmations. These are the four confirmation that are required in order for us to enter the market in this set up
1st Confirmation: Retest at one of the designated fib levels. The fib levels need to be measured from the H4 or higher
2nd Confirmation: Retest at a zone of Supply and Demand. The Supply and Demand zone needs to be formed from the H4 or higher
3rd Confirmation: Confirmed engulfing pattern in the direction of the trade starting at the H1.
4th Confirmation: Break of support or resistance in the lower timeframes starting with the 3 minute in the direction of the trade.

Optimistic Bitcoin cycle strategyThe optimistic Bitcoin cycle shows how the price will move during this bull run. My strategy predicts the cycle top in Q3 2025, with profits taken above Fibonacci levels and market capitalization growth to $4.3 trillion. In this scenario, the price is estimated to reach about $240,000. This possibility is supported by the SEC approving Bitcoin and ETH ETFs. Currently, we are post-halving and there is high demand for BTC from large funds. Considering the potential for this cycle to accelerate compared to previous ones, I will be monitoring the market more closely from the end of this year to maximize profits.

Amiriimport pandas as pd
import matplotlib.pyplot as plt
# Load data
# For this example, we'll use a CSV file with 'Date' and 'Close' columns.
# Adjust the file path as needed.
data = pd.read_csv('path/to/your/data.csv')
# Convert 'Date' column to datetime
data = pd.to_datetime(data )
# Set 'Date' column as the index
data.set_index('Date', inplace=True)
# Define the short-term and long-term moving averages
short_window = 50
long_window = 200
# Calculate the short-term and long-term moving averages
data = data .rolling(window=short_window, min_periods=1).mean()
data = data .rolling(window=long_window, min_periods=1).mean()
# Create signals
data = 0
data = np.where(data > data , 1, 0)
# Generate trading orders
data = data .diff()
# Plotting the results
plt.figure(figsize=(14, 7))
# Plot the closing price and moving averages
plt.plot(data , label='Close Price', alpha=0.5)
plt.plot(data , label=f'Short {short_window}-Day MA', alpha=0.75)
plt.plot(data , label=f'Long {long_window}-Day MA', alpha=0.75)
# Plot buy signals
plt.plot(data [data == 1].index, data [data == 1], '^', markersize=10, color='g', lw=0, label='Buy Signal')
# Plot sell signals
plt.plot(data [data == -1].index, data [data == -1], 'v', markersize=10, color='r', lw=0, label='Sell Signal')
# Add labels and legend
plt.title('Moving Average Crossover Strategy')
plt.xlabel('Date')
plt.ylabel('Price')
plt.legend()
plt.show()
