Bitcoin's Trend Changes after Reaching 0.5/0.6 Fibonacci LevelBTC Trendline Breakout, so market may retrace to Fibonacci levels 0.5(63919) or 0.6(62196)...
After reaching these levels, BTC may either Bounce or change from Downtrend to Uptrend.
I want to help people Make Profit all over the "World".
BTCUSD trade ideas

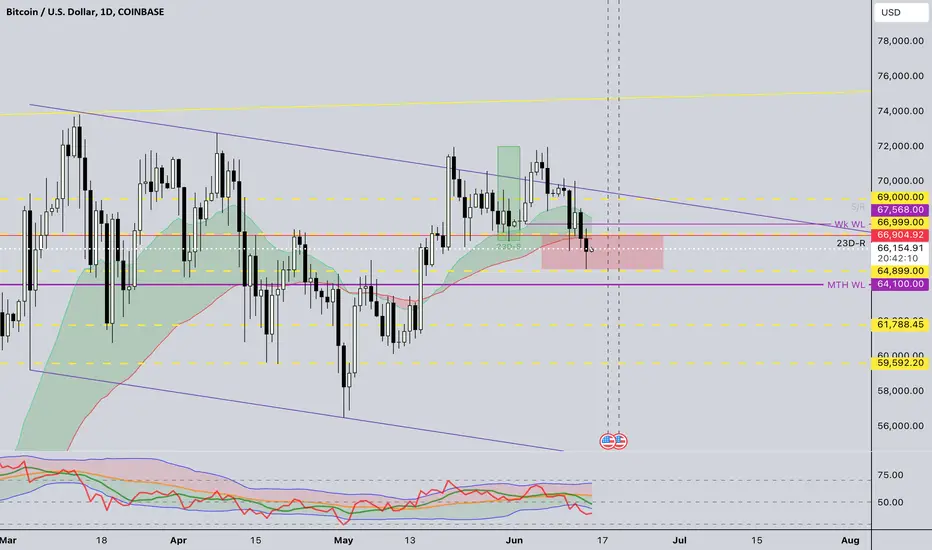
BTCUSDT 1D - Control LevelsBTC USDT 1D
BTCUSDT has 1 impulse wave left that can take it to the 80k 85k area.
65k corresponds to a support zone for the bullish trend. If you break this level, you lose the support zone to push up to 80k - 85k. Below 65k it is better to be outside and wait for a signal that confirms the return to the bullish path.
If I broke the 59k zone, I could fall without a parachute directly to 40k.
______________________________________________________________________________
BTC USDT 1D
A BTCUSDT le queda 1 onda de impulso que le puede llevar hasta la zona de 80k 85k.
65k corresponde a una zona de apoyo de la directriz alcista. Si rompe este nivel, pierde la zona de apoyo para impulsarse hasta los 80k - 85k. Por de bajo de 65k es mejor estar fuera y esperar una señal que confirme la vuelta a la senda alcista.
Si rompiese la zona de 59k, podría caer sin paracaídas directamente hasta los 40k.


Bitcoin sellBitcoin has made another lower high, now is the opportunity to sell with the stop loss just above the last high

BTC - Loving fractalsIMHO fractals appear when liquidity/volume drops and crypto comes to patience mode with long formations and either Bart heads or bots stable buy within ranges.
For now we are in a perfectly executed fractal mode with the last two points to complete.

Bitcoin Price Prediction For The Rest Of 2024The recent fall on Bitcoin has done little to worry investors.
And, it shouldn't particularly. These fluctuations can b normal across the board for anything that has rallied significantly.
It's what you do from here Technically, and fundamentally that counts.

Could Support @ $65K be New Low? - BitcoinHere I have Bitcoin on the 4 Hr Chart!
In the Overall Daily Chart, price on Bitcoin looks to be Consolidated!
But scoping down to the 4 Hr, we see Price has been using this Support Zone @ $64,500 - $65,500
- Feeding the Bullish Bias is purely boiled down to Technical Analysis being the:
- Tweezer Bottom
&
- Bullish Engulfing Candlestick Pattern forming ..
@ an interesting level of SUPPORT!!

Bart Says HelloWith resistance locking in what seems to be Wave 4 of a potentially leading diagonal wave (see orange circle), unless bulls can push price back above $72K in the days ahead, its probably best to consider the idea that Bitcoin has printed its top already for 2024.
If so, we can expect Bitcoin to fall steeply for the next 2 years roughly.
Target?
$5.00

Btcusd butBreakout to the upside, liquidity sweep on the bottom signalling bullish direction, bullish market structure, confluence with 1hr and 4 hour, reaction at support line, it's failing to go down to 66000

Will Bitcoin ever break above it's old trend line again ? The point of this chart is not to look at future peaks, although we will touch upon it. The point is to take a dive into the indicator called the BTC log regression {Rainbow Dark} that is based on the Fibonacci sequence and the possible transition to the lower band from the top band.
Bitcoins entire history has been on the upper band of this log and in the recent crash of this year it has broken below. It did break this upper band support once before it the covid crash of 2020 marked with the orange circle. Price action broke through but as we can see it quickly recovered and held as support into the eventual bull run. This sequence of events seems to have left us a couple of clues, being the first time there was a substantial breach of the bottom and the bull run not hitting the top. I think yes, it could telling us that Bitcoin is now transitioning {reset} to the lower part of the band and it's most likely could be the new trending range. To confirm this theory we need two touches, one on top and one on the bottom.
In my opinion the only questions that remains is which line will be touched first and what will be the path. I do believe the top of this lower band could be the top of Bitcoins next bull run and the bottom of could be the bear market, of course only time will tell. I do not believe we ever go to top of the band ever again and could possible be the new resistance point for future bull market tops.
Just purely on looking at this lower band and assuming that we have a new bull market that tops in March of 2025, price point is showing a possible of just over 200k top.
My speculation is bitcoin moves towards the top first and then touch the lower part of the band later next year at relatively the same price point as now which would mark a double bottom that ultimately sparks the new bull run. There is only one thing for sure, Bitcoin will surprise everyone.
Keys to look at is the stochastic RSI. this will show which way momentum is going.
This is not financial advice and should not be taken as such. it's an observation.
Thanks for looking and leave comments below.

Bitcoin on a bearish trend but shows potential of a reversalBitcoin is currently on a confirmed bearish trend as it made an M formation with a support of about $67 000 and resistance of about $71 900, this is a confirmed bearish trend because it broke through the support and retested however, it still has not reached the lowest point of the last bullish start point which was $56 591 so that is the point where it is headed where it will make another support,likely to make a reversal at that point turning to a bullish trend that is likely to go through the ATH of $73 832, so dont be afraid to buy the coin as it goes down, you will thank yourself for the risk you have taken

Bitcoin price prediction, looks like its going to drop to a suppBitcoin looks like its heading for a support of $56 300, dont be afraid to keep buying the coin though as it showed potential of going up in the last weeks when it was triggereing the all time high of $71 000. It is simply giving investors a chance go maximise their profits because next time it shoots up to $70 000 it might go past the ATH going even over $80 000, watch how other investors predicted the price some of the most sensational investors predict it might even go over $100 000 so don't be afraid to buy the coin, you'll thank yourself later for the risk you took

Crypto & Portfolio market are in the endo f B waveAccording to my waves count the market top was in November 2021.
Decline belowe 44k will confirm we are in C wave. The target of wave C might be at least 18500k.
However, the structure of this formation may have a more complex form. This may turn out to be a Zigzag. The exit from such a zigzag may last until 2028.
This scenario is canceled if the price closes above 74 thousand

LONG X 50 HIGH PRECISION ODER FLOW TRADINGBTC futures leverage x 50 LONG
Entry Point : USD 64700
Goal : USD 70000
Stop Loss : USD 64100
Stall Brake : ??? USD
Leverage is extremely risky and must be executed with money that we are willing to lose or hit the stop loss.
Trading is the only profession in which the only person responsible for our actions is ourselves, our worst enemy is ourselves, here there is no one to blame, this is not a collective work, the only one who presses the sell button buy and know how much you invest and where to put a stop to losses, it is you, and only you, so always remember that.
Important note: THE LEVEL OF LEVERAGE OR LEVERAGE, the alert for taking early profits, loss stop adjustment and forced operation closure are not done by this means.
And also remember to always have control over your losses, focus on this and you will last.
Comment: WARNING!!!!
I AM NOT A FUTUROLOGIST, I DO NOT MAKE PREDICTIONS, I DO NOT DO ANALYSIS,
I AM 100% A MARKET OPERATOR, I WORK BASED ON MY EXPERIENCE, CONSISTENCY AND MY PLANNING IN TRADING.
Leave a comment that is helpful or encouraging. Together we can dominate the markets.

New ATH in augustIf my idea is correct we are about to bouncing and retest ATH, and we're about to hit the inflection point. TA is showing levels of support that have not been broken yet, and show that we could hit a break out soon.
From a chart perspective we see an ascending triangle forming roughly at the end of a reverse head and shoulders. meaning the bounce of the shoulder should meet and test the neckline.
TA might just be astrology for men, but if it can be 60%+ accurate than it could be worth taking a bet on this position going long and setting a stoploss at 64k roughly. just be weary because in choppy markets you can get wicked out.

all you need to knowSpeaks for itself. No need for boring talk about waves, fibs, wyckoff etc. This single signal works always.
Good luck.

Bitcoin: Soon to Break 90k Equilibrium PointUnveiling Bitcoin's Macro Trajectory: A Data-Driven Approach
This analysis takes a long-term view of Bitcoin's potential, leveraging Goldbach's Conjecture (PO3 number 177147) to identify key accumulation and breakout zones.
Past Performance Informs Future Potential:
June 2022 – March 2023: A prolonged consolidation period aligns perfectly with Goldbach's Order Block zone, suggesting a period of strategic accumulation.
Catalysts Fueling the 2023 Surge:
August 2023 – January 2024: Speculation surrounding ETF approval, AI integration, and rising institutional involvement fueled a significant rally, creating a "liquidity void" within Goldbach's levels.
Current Market Positioning: A Discount Opportunity?
Despite recent gains, the current price remains within the "Bargain and Range" (BR) zone, well below equilibrium levels (estimated at $88,437-$90,000). This suggests a potential discount window for long-term investors.
Predicting the Next Move: A Data-Driven Approach
If Goldbach's framework holds true, Bitcoin is poised for a significant upswing, potentially reaching $99,000 near the "Mitigation Block" (MB) in the near future.
Conclusion:
This data-driven analysis offers a unique perspective on Bitcoin's macro trajectory, highlighting potential buying opportunities and future price movements based on historical accumulation patterns and Goldbach's Conjecture.
Further Reading: Goldbach Trading Basic Guide
This guide introduces the basics of Goldbach trading, a technical analysis method that uses Fibonacci numbers (specifically powers of three) to define price action in financial markets.
Key Concepts
Dealing Ranges: Goldbach theory suggests that price movements occur within predefined price ranges based on powers of three. These ranges are fractal, meaning they exist on all timeframes.
PDAs (Premium Discount Arrays): These are zones where price is more likely to find support or resistance. Goldbach defines specific locations within a dealing range for these zones.
Rejection Block: Area where price is likely to be rejected.
Order Block: Area where large orders are placed, creating support or resistance.
Fair Value Gap: Price gap that is likely to be filled.
Equilibrium: Price level where buying and selling pressure are balanced.
Algorithms: The instructor mentions two algorithms (Algo 1 and Algo 2) for entering and exiting trades based on Goldbach principles.
Benefits of Goldbach Trading
Precise Entry and Exit Points: Goldbach aims to identify high-probability entry and exit zones based on predefined price levels.
Improved Risk Management: Knowing potential support and resistance areas can help traders manage risk more effectively.

Buyers Defending BTC at $65000Buyers are defending BTC at $65000 levels after a break of HS at $67000 levels. $65000 level was tested ones on 16 May 24 and recently 15 Jun 24. It was also 1 Apr 21 ATH. If broken, more to the downside.
BTC-USD | 4H | SHORT | TECHNICAL CHARTHello traders, there are very few successful people in this business. Please do not believe or trust every trader and chart that comes your way.
I have set my target on the chart. Those of you who know me know that my targets will always reach their target. Drawings are very important in this business. If you make the right drawings, you will reach your goals.
Dear friends, I think there will be purchases from the BTC fibonacci 0.618 level.
But if you want to receive continuous updates under this post, there must be at least 50 likes.
Thank you to all the traders who support me by like.
I wish you a happy trade.
Regards, Love.

Bitcoin Continuing Micro Wave C of Y
Bitcoin should continue declining until we can count five waves inside micro wave C. However, as prices are already closing in on the potential targets of 50% or 62% retracement, if any trade is entered now, it should have a low reward-to-risk multiple to avoid prices turning around before your profit target is hit.

BTCUSD Potential Bullish Bat PatternOn the daily chart, BTCUSD has formed a double top pattern, and the short-term bearish trend is dominant. At present, we can pay attention to the support near 66000. If it falls below, it is expected to fall further, and the downward target is around 61500. When BTCUSD reaches 61500, we can pay attention to the potential buying point of the bullish bat pattern. At the same time, this position is in the previous demand area.

$BTC may have a very short term bounceBullish divergence is formed in lower time frame #bitcoin #btc chart. Minor bounces may be necessary. Not financial advice.

ANALYSIS BITCOIN AS SPECIAL TRADES 20/06/2024Chart Overview
Volume Profile:
Visible range volume profile is displayed on the left side of the chart.
High trading volume zones are marked by longer horizontal bars.
VWAP (Volume Weighted Average Price):
Weekly VWAP levels are shown, currently at 66,061 and 64,843.
Trendlines and Channels:
An upward trendline seems to be in place from the lower left to the upper right.
A descending channel is indicated, with Bitcoin currently trading within this channel.
Support and Resistance Levels:
Key resistance levels are marked around 66,370 and 70,000.
Important support levels are around 60,129 and a potential lower target at 56,272 based on the Fibonacci extension (1.618 level).
Recent Price Movement:
Bitcoin is currently at 65,151, recently bouncing off the lower boundary of the descending channel.
Short-term resistance is at 66,370, with a potential break higher to 70,000 if momentum continues.
Analysis and Projections
Bearish Scenario:
If Bitcoin fails to break the descending channel and the resistance at 66,370, it could continue to decline.
The next major support levels to watch are 60,129 and 56,272.
A break below 60,129 could indicate a bearish continuation.
Bullish Scenario:
If Bitcoin breaks above 66,370 and sustains the momentum, it could aim for the 70,000 resistance level.
Sustained trading above 70,000 could indicate a trend reversal to the upside.
Volume and VWAP:
Pay attention to the volume. A breakout with high volume above resistance levels would be more significant.
VWAP levels (66,061 and 64,843) are key for understanding the average trading price and potential support/resistance.
Summary
Critical Levels: 66,370 (resistance), 60,129 (support), 56,272 (Fibonacci extension).
Trend: Currently in a descending channel; break above 66,370 needed for a bullish signal.
Strategy: Watch for volume and price action at the key levels mentioned for potential entry and exit points.
