$BTCDCA on the fib lines area
BTFD pull back is fine my plan is to save and buy when the fib lines gets hit.
BTCUST trade ideas

#btcusdtIf btc break the support at $66199 , btc next target is $60000
But Btc might be bounce back from $66199

#btc #btc updates 👇
Recently #btc is trading between FWB:67K to SWB:69K , if btc daily candle closes below FWB:67K #btc will drop up to $50k , this is the last dump before the mega #bullrun
And #btc daily candle closes above the $68k and trading above for a few days then #btc start rally
#NFA
#DYOR

$BTC price is confirming the correction?As seen on the chart, less than a month period, #bitcoin did unable to cross 72K, after 2 major declination, formed bearish double top pattern. Also in 3 months period, CRYPTOCAP:BTC formed Wyckoff' s distribution schematic and proceeding to last confirmation of the major correction. In lower time frame, #btcusd dumped from 70K to 66K heavily and lost the trend line (black line) support. Before CPI, yesterday attempted to reclaim the trend line but price heavily declined from 70K. So, #btcusdt did a bearish retest and reclaiming the trendline failed with this fake pump.
If we want to see a bullish #btc , the price must reclaim 72K permanently, otherwise the next major support zone is given on the chart (the red box).
Not financial advice.

BTCUSDT :Every week, we will be negative like this
I still don't decide to sell bitcoins because I believe that the floor of 48,000 is the time to sell bitcoins
Now I have bitcoin hold, cell, link and ethereum
It is not yet time to collect the basket
Maybe people are buying altcoins because when Bitcoin turns red, Dominance Bitcoin turns green or vice versa.
Below 67223, open short position for long position, not for now
I'm not going to open a long position until the box is made and the ceiling is not raised. Sharp is also gone, what should I do? We will take the next one

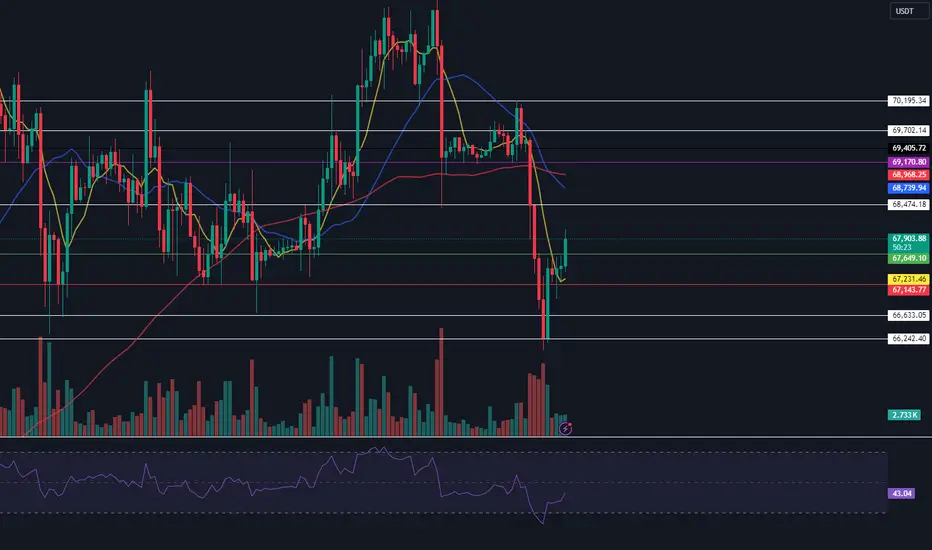
Bitcoin and altcoins overview(June 13-14)Yesterday, there were real "roller coasters" for Bitcoin. After inflation in the US unexpectedly turned out to be lower than forecasted, the market reacted very positively at the moment.
We almost effortlessly broke through the selling area of $67,700-$68,300 (pushing volumes) and reached more significant marks of $68,900-$69,800 (accumulated volume), from which we received a strong seller reaction and returned to the opening values of the previous day.
Now the largest volumes are located above current prices. Braking volumes have formed at the $68,900-$69,800 marks, so this area remains active.
There is a high probability of testing the $66,000 level, at the false break of which it is possible to look for longs according to the wave model, also the long scenario can be implemented after the price is fixed above the $68,900-$69,800 area.
Selling zones: $68,900-$69,800 (volume anomalies), $70,800-$71,400 (accumulated volume).
Buyer zones: $67,000-$66,500 (buyer volumes), $64,500-$62,700 (pushing volumes), $61,200-$60,400 (volume zone) $58,500-$57,000 (volume anomalies).
Interesting altcoins.
PEOPLE broke the 4-hour sloping line, we look at the short either from the current ones, because at the moment we are within the volume zone, or from the $0.122-$0.126 area. The target, at least, is to the extreme $0.1

BTCUSDT Trading Signal: Sell OpportunityDear Traders,
Our analysis indicates a significant sell opportunity for the BTCUSDT pair based on current market conditions and the application of our EASY Quantum Ai strategy.
Direction: Sell
Enter Price: 69540
Take Profit: 69076.21333333
Stop Loss: 70099.86333333
Analysis Summary:
1. Market Sentiment: Recent trends show a shift towards bearish sentiment, with multiple resistance levels being tested and not surpassed.
2. Technical Indicators: Our EASY Quantum Ai strategy has identified a convergence of several technical indicators pointing towards a downward movement. This includes moving averages, RSI levels, and MACD intersections, suggesting a strong sell signal.
3. Volume Analysis: Decreasing volume on upward movements indicates weakening buying pressure, while increasing volume on downward trends supports our sell signal.
4. Economic Factors: Ongoing macroeconomic uncertainties and market reactions to recent geopolitical events have increased volatility and risk, contributing to potential downside movements.
By entering this sell position at 69540 with a target profit level of 69076.21333333 and a stop loss at 70099.86333333, we look to capitalize on the expected downward trend while managing risk appropriately.
Stay informed and manage your trades carefully.
Best regards,
The Trading Desk
(EASY Quantum Ai Strategy)

Bitcoin hangin out at the topHappy Holidays Tradingview Peeps!
Yep, bitcoin at the top of this channel
Will we see a pullback to the bottom of this channel? 40K
OR
Can we see a break out with continuation?
Lets see the volume!
The RSI is Over bought....
Can we get a Santa Rally!
or a Grinch Pull Back! LOL!
Merry Xmas!
Have a blessed and safe one!
Lets go 2024!
You Got To Be Aware
Good Luck Out There

Massive Volatility For BTC During FOMC / CPIAs you can see from the chart,
Beginning last week, there was a leverage flush on CRYPTOCAP:BTC
- Following another flush leading into the CPI data
- CPI data was positive, which led to a pump
- FOMC meeting and Jerome Powell speech 6 hours later leads to a correction again.
Trading this is a massive opportunity, not understanding what's going on is a massive risk.


BtcUsdt Elliott wave countBelow 73881.4 we are looking to the downside to unfold wave ((4)) of wave 3.
Possible targets 0.382 fib retracements also key level previous wave (4) 59112 zone.

BTC price prediction and Elliott wave analysis Hello Friends,
I consider that, if the price reaches to 68310, it will be the confirmation to go for uptrend and also I need to break the white trend, but if the price returns to break 66000 we will get another downtrend.
Thank you for joining me in my analysis, remember to like, subscribe and stay tuned for more updates.
Thanks Bros

BTC reaching 80kwe will probaly see BTC breaking previous ALTH, price still in a bullish structure, looking for a CHOCH around 64k which aligns with a FVG and 62% of fibonacci.

BTCUSDT :Both the interest rate and the inflation will come
These two are American financial news
Because the market does not have momentum, it follows that the crypto market will take a hit
I feel that the inflation is decreasing
Pavel, it is better to reduce the rate, for example, pump sand
Bitcoin showed the same direction at 66029 and went back up
Open a short position below 67154, but not close to the news.
Whenever it closes below 67146 candles on the hour
Open a long position after 67644, but I don't open a long position
If Bitcoin wants to rise, Bitcoin's dominance will probably fall. Altcoins are good in the middle
When they fall, they use altcoins, and when they rise, they use bitcoins as Tether.
$BTCUSDT NEXT MOVE?After yesterday's sudden drop an all major crypto the correction bact to 54,000 seems more posible if 68,900 stands. However if the next move pushes past this zone then we could be looking at the next bull run to 75k or above

BTC my trade planThis is my trading program on Bitcoin, and I expect the price of altcoins to fall even up to 50% in the coming days, and after that, the attractive growth of crypto.

BTC Technical Analysis. "Our greatest glory is not in never falling, but in rising every time we fall"
Dear Analysts and Traders,
I would like to share my latest look at the BTC price chart. First of all, I would like to point out that I am not a person who received a targeted education. I am a self-taught person who places particular emphasis on the use of Technical Analysis as the main component of the decision-making process. This is due to my approach, which assumes that the chart, although difficult to read, allows for the interpretation of the hidden intentions of "smart money". I would like to emphasize that the following words only illustrate my point of view, which does not have to be right, and that the publication is absolutely not investment or educational advice within the meaning of any law regulating these issues. I'm just going to talk about things I don't know anything about. In the analysis, I will use my own indicator, which is publicly available. The average value of the indicator is obtained from all visible data on the chart.
Background
In the graph showing the period from aprox. November 2022, I see a strong upward trend, which has been broken several times by the accumulation structure. The price stops around $74k, which means the price has increased by about 370%. In the more recent past, I notice a price formation resembling a double top on the chart.
Situational analysis
I analyze the chart using three volume profiles, elements of Elliot's theory and harmonic structures.
In my opinion, the most important element of the chart is the horizontal structure, which I consider to be the probable distribution. I think so because I see several indications in the chart that suggest so. The first is a structure referring to Wyckoff's theory and VSA elements. The trend and structure are in the upper part almost from the ruler, there are distribution signals that are stronger than accumulation ones, which I marked with colored arrows. In my opinion, the Bitcoin price chart represents Phase B of distribution. I see demand exhaustion near possible Uphtrust. I marked events consistent with Wyckoff's methodology in white letters.
There is a Volume Reversal Pattern between the last two highs.
The earliest profile shows a POC equal to my proposed price level, which would be the D vertex of a potential harmonic structure - the bullish bat. Looking at the second chronological volume profile, I see supply signals crossing the upper limit of the trading rank created by the profile from below. On the third, most important profile, I see a High Volume Node equal to the VOP of the first profile and also the D point of the bat. From the Elliot theory side, I believe that the price is stuck at the end of the fifth wave and I should expect a correction. I also pay attention to the time dimension. The time to cover the distance between extremes during an impulse is equal to the time between the next such event. Considering the time zone according to the Fibbonaci numbers and the impulse wave, I see a comparable distance between the X-A and B-C-D vertices.
Interpretation
Given the number of signals suggesting the significance of aprox. $43k, I think there is a high probability that this analysis will come true. Thinking about the volume ratio between accumulation and distribution, I dare say that it is possible for this accumulation to be the initial support in a Wyckoff higher-level structure.
I am very glad that this analysis was created because, especially if implemented, it will be a broad synthesis of various Technical Analysis methods to study market behavior.
Whoever reached the end of my thoughts, I thank you and I hope that the time to explore my thoughts was not wasted.
Fruitful trades and flawless analyses!
CatTheTrader

BTC - Update before CPI This is a chart we have been following since this post:
This pattern has been validated by multiple touchpoints on LTFs. For bullish continuation, we need to see BTC's 1D candles continue to close above this orange trendline for confirmation.

BTC/USDT consolidation and moving upDate: June 11, 2024
The current trend for BTC/USDT over the past two weeks shows a sideways movement with slight bullish tendencies. Here’s a detailed analysis:
Price Performance: Over the last two weeks, Bitcoin has fluctuated between $66,000 and $71,000 USDT. The price is currently around $66,790 USDT, having seen a minor decline of approximately 2.97% over the past week (TradingView) (Investing.com) (Crypto Futures Info).
Support and Resistance Levels: Bitcoin is holding steady above the critical support level of $66,000 USDT, while the resistance is around $70,000 USDT. This resistance level has not been significantly breached, indicating consolidation in this price range (TradingView).
Market Sentiment: The market sentiment is currently neutral, with oscillators and moving averages suggesting a balanced view between buy and sell signals. This neutral sentiment supports the sideways trend observed in the price movements (Crypto Futures Info).
Overall Trend: Given the data, Bitcoin is currently trending sideways with a slight bullish bias as it consolidates within the $66,000 to $71,000 range. The market appears to be gathering strength for a potential upward move, but clear signals of a breakout or downtrend are not evident at this time (TradingView) (Crypto Futures Info) (CoinCodex).
In conclusion, BTC/USDT is exhibiting a sideways trend with consolidation around key support and resistance levels, and the market sentiment remains neutral.

BTC Still BullishThe BTC still bullish, we have two active bullish harmonic patterns. Also we have two active bullish SK sequences.
Closing under 64603, may targets 60526, and that will invalidate the bullish move.


$btc longbtc currently sitting on 66k support after failure to break ATH , this is a good dip to buy bitcoin and alts as most have taken upto 20% damage

Technical Analysis June 11thIf we break the 67k mark in the following hours BTC might drop to the 61k-60k zone. From there, maybe bounce back up? Or maybe even a more bearish scenerio? It seems that we will not touch the ATH in a while since summer is also not a good time for BTC
