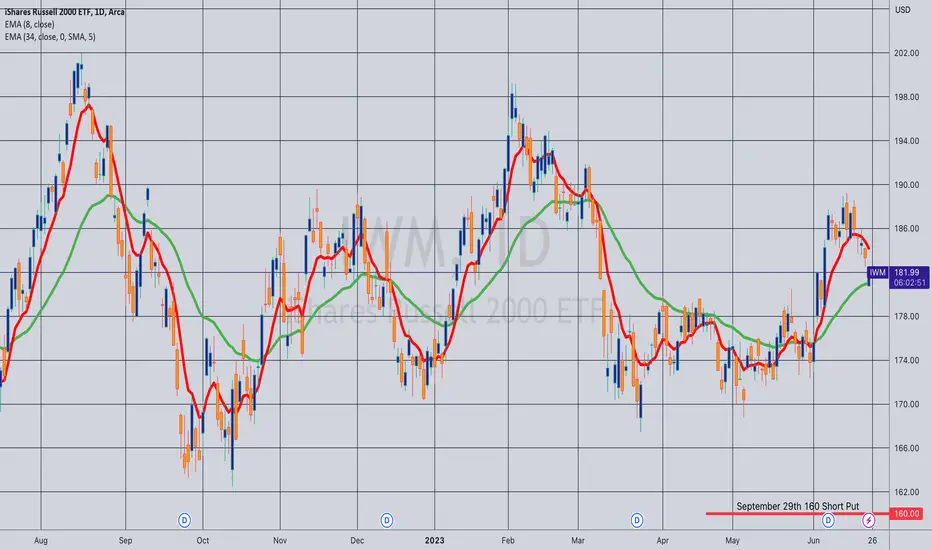
Opening (IRA): IWM September 29th 160 Short Put... for a 1.67 credit.
Comments: Targeting the <16 delta strike in the shortest duration where the credit received is around 1% of strike price to emulate dollar cost averaging into the broad market.
IWM trade ideas
preview for the week - SPX, NQ, IWM, KREAll in the video. According to what I'm seeing in the ratio charts, IWM and KRE may lead to the downside so I'm expecting some bank news which has not hit yet. Tech will probably stay relatively strong for at least a week or more, while SPX may want to try for 4500. It's a shortened trading week, and they are usually very slow but a surprise in the regional bank sector would not surprise me.
Good luck!

IWM: Something is Rotten in the State of MarketsPrimary Chart: IWM on a weekly timeframe with downtrend line and major support and resistance zones
Note1: IWM is an iShares ETF that represents the Russell 2000 small-cap index in the United States. Though not as widely tracked as SPX, NDX, or DJIA, the Russell 2000 ( TVC:RUT ) is one of the major US indices. It is likely the fourth most watched US index.
Note2: The phrase "something is rotten in the state of Denmark" is a well-known line from Shakespeare's play Hamlet used to describe a situation where something is wrong or even corrupt within a government, institution, or system. No corruption is intended to be implied discussed. The title's allusion to this phrase is meant to suggest only that something is off / wrong in the markets, i.e., that everything is not well despite the strength of the Nasdaq 100 lately and the support seen in SPX.
The Russell 2000 (IWM) is often a leading indicator in US markets. It led to the downside in early November 2021 after a false breakout out of its 2021 topping-pattern's resistance around $234. SPX topped nearly two months later on January 4, 2022. While small-caps are not necessarily always the first to make a move, it is something frequently cited by commentators and analysts.
The primary chart shows how IWM has struggled below the upper blue rectangular zone, a resistance / supply zone going back to highs in March and April 2022. This zone also rejected price at the end of the impressive August 2022 rally that had everyone debating whether the bull-market had returned in earnest. Lastly, on February 2, 2023, IWM was unable to even tag the lower edge of this zone, eking out a high at $199.26. The lower edge of this blue resistance zone as drawn here is at HKEX:200 - HKEX:201 approximately.
The Primary Chart above also shows an important Fibonacci support level at $170. This the 50% retracement of the entire bull market from the 2020 Covid lows to the highs in November 2021. This has also marked important support since late October 2022 (a week or two after the October 2022 lows). Notice the weekly candle wicks protruding below this line but recovering back above it.
The final point about the Primary Chart is the down TL from the all-time high in magenta. This was broken to the upside, which was one of the reasons many market participants and commentators got excited about the bear being complete. That trendline was retested in late March 2023. But despite this positive development, IWM has not acted well. In fact, it has broken decisively below a multi-month upward trendline from October 2022 lows as shown on the Primary Chart as well. This trendline was also important and signifies weakness on the decisive break below it.
On the larger scale, price is trapped between the blue rectangular zones of support and resistance. Until these break, not much progress is likely in either direction. Sideways action is likely for the coming weeks. The one thing that would negate the sideways action view is a clean break back below the down trendline from the all-time high. So keep an eye out for that development.
Next, Supplementary Chart A.1 and A.2 below shows a hypothetical illustration of how price could move sideways for the coming weeks / months before a flush below major support (if one is bearish about equities generally) or a rally above the key resistance zone (if one is bullish about equities generally). SquishTrade gives an edge to the bears in the intermediate to longer-term time frames—as long as price stays below both (1) the uptrend line from October 2022 lows, and (2) the key Fibonacci levels of the most recent decline (shown on the Primary Chart at $183.36 and $187.11).
Supplementary Chart A.1 (measured corrective move upward where the legs of the corrective move might be equal or share a 1.272 Fibonacci relationship)
Supplementary Chart A.2 (choppy sideways action that retests the upward TL from the October 2022 lows that had broken down in March 2023 before heading lower again)
Supplementary Chart B is a zoomed-out version of the major resistance and support level shown on the Primary Chart. This is intended to show the ranging action for months that has taken place despite periods of seemingly impressive strength and sharp weakness.
Supplementary Chart B
The next chart, Supplementary Chart C, illustrates what a trendline might look like if someone were considering this chart afresh, i.e., for the first time without having tracked the prior trendlines during the 2021-2022 bear market. The TL has been re-drawn to account for the recent major highs at the end of the January to February 2023 rally.
Supplementary Chart C
IWM's anchored VWAPs are not encouraging. Here, the only VWAPs considered are the one anchored to the all-time high in November 2021 (blue-purple line) and the 2022 low (orange line). Price made a false breakout above the VWAP from the all-time high and failed back below. That in itself is a negative especially given that this occurred on a larger time frame going back to 2021. Price has also failed below the October 2022 VWAP as well.
Supplementary Chart D
Finally, and most importantly, consider the ratio spread of IWM/SPY in Supplementary Chart E below . This tracks the performance of the Russell 200 relative to the S&P 500. This is why something might be rotten in the state of Denmark (markets). A healthy market should not have an index looking this bad. Let me know what you think in the comments.
Supplementary Chart E
The ratio spread shows that IWM's underperformance just broke below a key support level for that ratio. But bigger support lies below. However, the overall picture looks bleak for IWM with a downtrend line that has lasted for a while, and lower highs for the ratio's value on higher time frames.
________________________________________
Author's Comment: Thank you for reviewing this post and considering its charts and analysis. The author welcomes comments, discussion and debate (respectfully presented) in the comment section. Shared charts are especially helpful to support any opposing or alternative view. This article is intended to present an unbiased, technical view of the security or tradable risk asset discussed.
Please note further that this technical-analysis viewpoint is short-term in nature. This is not a trade recommendation but a technical-analysis overview and commentary with levels to watch for the near term. This technical-analysis viewpoint could change at a moment's notice should price move beyond a level of invalidation. Further, proper risk-management techniques are vital to trading success. And countertrend or mean-reversion trading, e.g., trading a rally in a bear market, is lower probability and is tricky and challenging even for the most experienced traders.
DISCLAIMER: This post contains commentary published solely for educational and informational purposes. This post's content (and any content available through links in this post) and its views do not constitute financial advice or an investment or trading recommendation, and they do not account for readers' personal financial circumstances, or their investing or trading objectives, time frame, and risk tolerance. Readers should perform their own due diligence, and consult a qualified financial adviser or other investment / financial professional before entering any trade, investment or other transaction.

IWM 200 soon not so far fetchedOn the weekly, IWM gives credence to bearish bias, however, if we look at the daily chart, there is also a good technical case for a potential run to 200.

Opening (IRA): IWM September 15th 153 Short Put... for a 1.60 credit.
Comments: Selling premium in the shortest duration where the <16 delta strike is paying around 1% of the strike price in credit to emulate dollar cost averaging into the broad market.

$IWM – Bull Flag Breaking Out?Hooray for small caps! It is looking to me like AMEX:IWM (Russell 2000 small cap ETF) is ready to participate in the newest market rally. This is great news as it shows the market is broadening with more participation. I do not have a position yet, but I am looking to start one if this keeps showing strength. I may even use the 3x levered AMEX:TNA as a booster. (Cannot hold levered ETFs too long as they are geared for day trades). Ideas, not investing / trading advice.
You can see I have outlined the Bull Flag as well as important moving averages. On the lower part of the chart, you can see the Volume has picked up, the MACD is rising and the indicator at the bottom shows market new highs new lows (new highs are green days).
I hope this helps someone. Thanks for looking. Constructive comments always welcome.

An upcoming broader rally?The overall market thus far has been propped up by just 5 stocks
1) Apple
2) Nvidia
3) Microsoft
4) Meta
5) Tesla
It is no secret the market breadth is not that great.
However, IF (IFFFFFFFFF), this is a healthy uptrend that is supported by the economy, we should see the rally becoming broader. I.E. Funds should flow into mid-caps and small-caps. There should be a reallocation of funds from overbought big caps to the broader market.
Russell 2000 is a good start and should be monitored closely for such actions. We may see a rally to 200 or even beyond.

Russell 2000 Order Flow: Bullish Pattern ActivatedHey traders,
In today’s analysis, it’s hard to ignore IWM following the 🚀explosive🚀 8%+ move up.
Let’s unpack the action as of late via the OFA script :
To do so, I am NOT going to apply any subjective type of analysis such as crawing trendlines, counting waves based on what way the wind blows, or any other form of guessing…
Instead, we let the formation of fractal structures (an objective measure of moves) create the pathway from which we can all make decisions.
Fortunately, there is no need to engage in laborious manual work. Why? The OFA script has all of us covered. So, with that in mind, what can we observe in the IWM market?
What recurring pattern do you notice? Clue - Pay attention to the visual CIRCLE feature in the last leg.
These patterns entail, “dynamic fractal-based order flow cycles where a decreasing involvement in one direction (depicted by cycle/wave/line counts) is followed by a predictable move in the opposite direction with greater commitment seeking out the next equilibrium area, in most instances, with potential profits as a by-product thereafter…”
If you are into disseminating order flow, nothing I’ve seen beats the objectivity in analysis one can carry out via the formation of structures derived off fractal structures.
So, how are you going to profit from the latest pattern printed? I know how I will...
Remember the two key main features of the OFA script:
Magnitude: A major clue that will help determine the health of a trend is the type of progress by the dominant side in control of the trend. We need to ask the following question: Are the new legs in the active buy-sell side campaign as identified by the script increasing or decreasing in magnitude?
Velocity: When it comes to the distance the price moves, the magnitude is only ½ the equation. The other ½ has to do with the velocity of the move or the speed. Was the new leg created after a fast and impulsive move? Or did price make a new low or high with the movement being sluggish, compressive and taking too long to form? A good rule of thumb is to count the number of candles it took to achieve a new leg.
DISCLAIMER: This post contains commentary published solely for educational and informational purposes. This post's content (and any content available through links in this post) and its views do not constitute financial advice or an investment or trading recommendation, and they do not account for readers' personal financial circumstances, or their investing or trading objectives, time frame, and risk tolerance. Readers should perform their own due diligence, and consult a qualified financial adviser or other investment / financial professional before entering any trade, investment or other transaction.

IWM - Perking up?Small caps have moved up to resistance. With Friday's move and todays move my guess is that the next move will be a consolidation of the almost 7% move in the last week. Volume has picked up but I wouldn't be surprised if there is just as much selling as buying into this lift. Economic factors do not have me pounding my fist to buy the most vulnerable companies out there. Typically small caps lead in a new bull market and not at the end of a cyclical bull inside a secular bear. My guess is to fade this move. I think markets want people to believe that the rally is broadening out and will pull the rug out on everything soon. Call me skeptical but I'm not in IWM until resistance is broken and there is a successful retest of the breakout.

IWM is going much much higher based on latest accumulation countThis idea is based on Wyckoff's accumulation schematic. The current accumulation count yields a much higher IWM target. All info is on the chart. Good luck.


Small Caps Are BackDon't miss out on the rest of the run just because you missed the first move.
*** Price action breaking above the 200 moving average after a healthy move that sustained
*** Plenty of head space to upper resistance
*** Lagging SP500 and NASDAQ

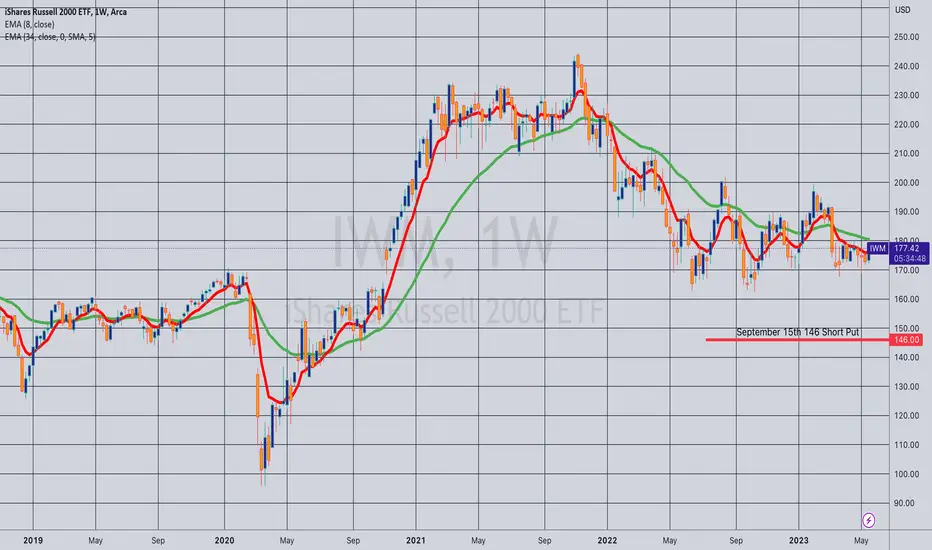
Opening (IRA): IWM September 15th 146 Short Put... for a 1.46 credit.
Comments: Re-establishing a September rung after scratching out a higher strike trade yesterday, targeting the <16 delta strike paying around 1% of the strike price in credit to emulate dollar cost averaging into the broad market.
The shortest duration trades in which the <16 delta strike is paying around 1% in credit:
IWM: August (at the 154 strike, paying 1.58)
QQQ: August (at the 296 strike, paying 2.99)
SPY: September (at the 367 strike, paying 3.70).
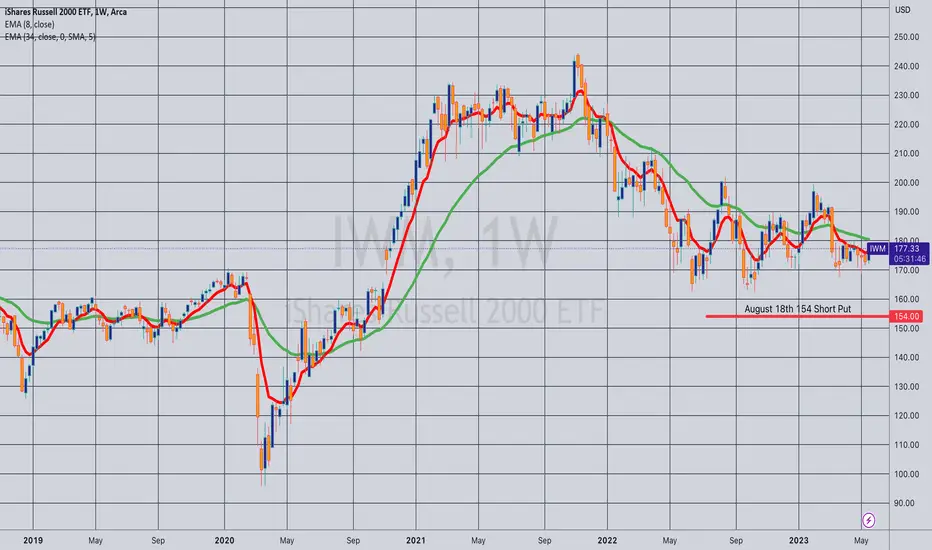
Opening (IRA): IWM August 18th 154 Short Put... for a 1.60 credit.
Comments: Targeting the <16 delta strike in the shortest duration paying around 1% of the strike price in credit to emulate dollar cost averaging into the broad market. Would like higher IV to sell shorter duration in, but you can't have everything.
$IWM Pierced 50% Fibonacci levelAMEX:IWM has a lot of bank stocks in the #russel2000 and is up over 2% today. Pierced the 50% Fibonacci level today. This tells me the #Federalreserve will pause tomorrow. #jeromepowell

Stock Chart Analysis 101, Recognize the PatternsIf you check my previous post about AMEX:IWM you will see that I signaled the potential for a lower high here. This is no confirmation of that being correct just yet. I just thought the opening of the week was extremely interesting.
Check out the Equity Channel Podcast on Apple, Amazon and Spotify for more information on trading and investing.

$IWM beginning of an uptrendAMEX:IWM beginning of an uptrend. #russel2000 Closed above the horizontal line and above the 20 and 50 weekly moving averages. Now it needs bullish consolidation and a retest of the horizontal line before it can break through the 200 weekly moving average.

Is This Another Lower High Incoming for Russell 2000?Check out the Equity Channel Podcast for more insightful trading and investing ideas.
Listen Here:

$IWM - Local technical breakout. Is it the right time to long?AMEX:IWM
Daily: Golden cross in process, however not happened yet.
Overall bulls are not in control yet below 189/190+. AVWAP at 188.19
Short-term, bulls legitimately succeeded to trigger a technical breakout at 180.85 with volume!
As long as 180.85 hold, price should head into 184.28, 188.74, 189.93 (breakout > 199.31).

WEEKEND UPDATE JUNE 4 2023 - SMALL CAPS JOIN THE PARTYMacro
2/10 YR CURVE - Inverted = -.81 (More Negative from -.74 last week)
HIGH YIELD SPREADS = 4.65 (Up from 4.58 last week)
US ISM PMI - Contracting Faster = 46.90 down from 47.10%
US ISM SERVICES - Growing Faster = 51.90% up from 51.20%
S&P 500 ( SPY ) - Investable
Nasdaq100 ( QQQ ) - Investable
Russell2000 ( IWM ) - Investable
Gold ( GLD ) - Investable(Pullback)
US 30yr Treasury Bonds ( TLT ) - Not Investable
US Dollar ( UUP ) - Investable
US Real Estate ( IYR ) - Not Investable
European Equities ( VGK ) - Investable(Pullback)
India ( INDA ) - Investable
Broad Asia Equities ( VPL ) - Investable
China A-Shares ( ASHR ) - Not Investable
Emerging Markets ( EEM ) - Investable (Pullback)
Wheat Futures (ZW) - Not Investable
Corn Futures ( ZC ) - Counter Trend Rally
Soybean Futures (ZS) - Not Investable
Silver ( SLV ) - Investable(Pullback)
Natural Gas Futures ( NG ) - Not Investable
Volatility Levels
S&P 500 - 14.60 - Investable Market (Down from 17.95 last week)
Nasdaq100 - 19.29 - Investable Market (Down from 22.21 last week)
Russell2000 - 20.88 - Investable Market (Down from 23.51 last week)
S&P 500 Volatility Structure - Normal Contango Structure
VIX 9-Day - 12.74
VIX Short Term - 14.50
VIX - 14.60
VIX Long Term - 14.79
Now, here is the list of individual ETFs and individual names are showing strength.
Strongest of our ETF universe
SVIX
SMH
XLK
QQQ
IGV
IWF
NIB
ARKF
ARKG
XLY
QUAL
EWJ
Strongest of our ETF Leveraged/Inverse Funds
KOLD
TQQQ
SOXL
QLD
SDP
KORU
WANT
SPXL
SPUU
RXD
INDL
Strongest of our Individual Equities
MDB
NVDA
META
AMD
CFLT
MRVL
AVGO
HUBS
EXAS
BLDR
GOOGL
NOW
SNPS
MSFT
CPRT
NET
AMZN
NFLX
ADBE
LRCX
TTD
RCL
SHOP
PACB
AKAM
TTWO
ORCL
KLAC
FSLY
VRSK
PANW
WDAY
ACN
MU
AMAT
CRM
AAPL
VMC
CDNS
SPLK
ASML
UBER
CCL
MLM
SNOW
DVA
CEG
ANET
DRI
IT
FTNT
COF
PTC
FLT
NTAP
STZ
MCK
PWR
MCO
GRMN
IPG
ETN
KEYS
NWS
SPGI
ANSS
STE
CSCO
CTAS
MKC
MPWR
EFX
TER

$IWM, #RUTAMEX:IWM , the Russell 2000, experienced a significant move on Friday, June 2nd, accompanied by high trading volume. On the daily chart, it successfully broke out of its structure, indicating the next potential levels at $185-190. If it manages to surpass this range, it could potentially reach $200 and even $220. It is worth noting that there are several bullish setups observed in mid-cap stocks.

IWM/SPY bounced off covid lowsimple long short, invalidation on breaching line, TP wherever tf u want (once cyclical sector growth starts slowing / negative catalyst hits?)

Still alive but...This is very risky, I bought puts strike 174 expire 06/16. I'm giving it a month, my idea is that the HS is going to to play out eventually but it may take some time. If it works, price will drop very fast.
