Small caps in for a lot of pain next week Bear flag Breakout happened friday.
Tp 211 or 200ma
This drop will hurt Evs, Clean/Renewables energy, Memes
IWM trade ideas

bearish wedge in IWM could lead to support test?IWM cant seem to make it back to all time highs like the major indices. Potential bearish wedge formation set up. Usually there is an attempt higher that if fails causes dip to wedge support.
My best guess and view is that IWM tries to rise and fails and then dips to support.
Disclaimer: I know nothing and cannot predict the future, listening to me will lose you money.

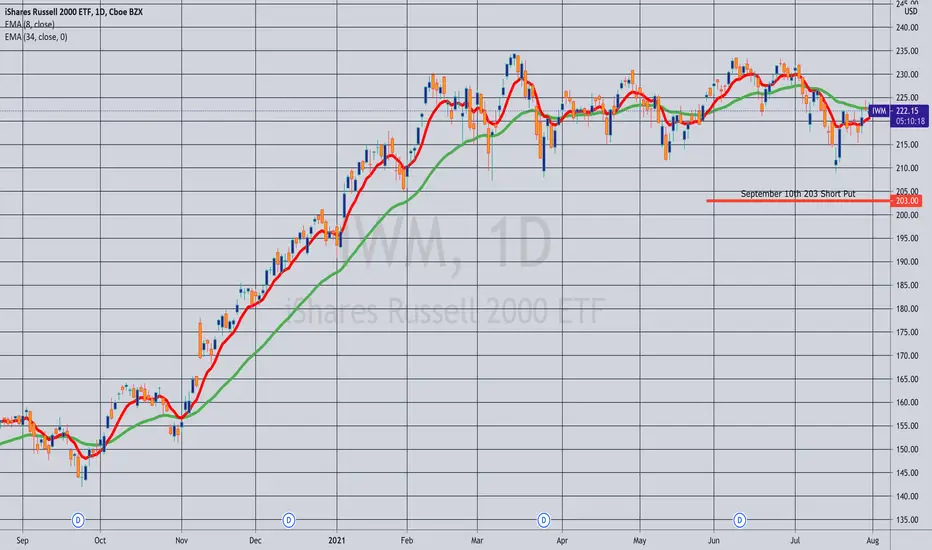
Rolling (IRA): IWM September 10th 203 Short Put to September 30.. 201 Short Put for a 1.27 credit.
Comments: I originally opened this for 2.02. (See Post Below). With only .68 left in it (>50% max), I'm rolling it down and out to the 16 delta strike in expiry nearest 45 days until expiry to reduce risk a smidge relative to where the underlying is currently trading. I'm opting to do this versus adding additional units, which I'll reserve for greater weakness.
Total credits collected of 2.02 + 1.27 = 3.39 versus a current short put value of 1.98, so by doing this I realize a gain of 3.39 - 1.98 = 1.41 ($141).
On a side note, I still have the September 3rd 198's on. I initially considered rolling those out in time as well, but would've rolled from the 198's to the 201's in the September 30th expiry as I did with these (i.e., not a strike improvement), so opted not to do that here, but rather just leave them alone for now and wait to either take them off on approaching worthless or -- if given the opportunity -- roll them down and out as well.

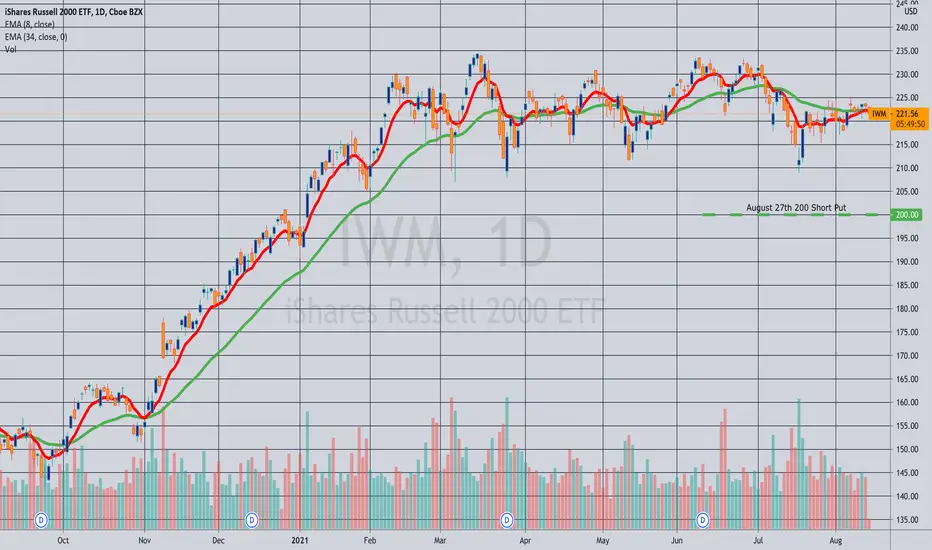
Closing (IRA): IWM August 27th 200 Short Put... for a .25 debit.
Comments: Plain Jane profit taking here with 14 days to go. In for 1.72 (See Post Below), out for .25 here; 1.47 ($147) profit.
IWM - Get in gear DG's and bid this JUNK up.As Independent Producers are failing one by one....
The Gamblers continue to BID the Russell 2000.
When this fails, it will lead.
The declines in the RTY will outpace all other Instruments
including the distant 2nd, the NQ.
Patience, HUGE Trade setting up here.

IWM/SPY Comparison Chart - Small Cap Rotation and Wave 5?See chart - for small cap rotation. Interesting weekly candle closing back above uptrend line. Apex mid September.

Closing (IRA): IWM August 20th 205 Short Put... for a .37 debit.
Comments: Another one I rolled, collecting credits along the way. (See Post Below). 5.72 in credits collected - .37 debit = 5.35 ($535) in profit. Still have the August 27th 200, September 3rd 198, and September 10th 203 on.

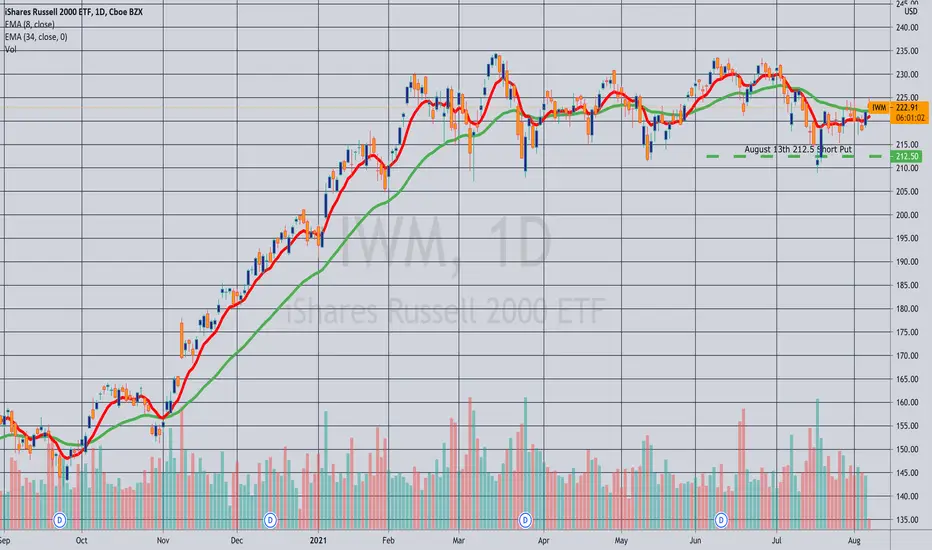
Closing (IRA): IWM August 13th 212.5 Short Put... for a .35 debit.
Comments: Taking profit with 7 days to go. I rolled this contract several times and collected a total of 7.19 in credits along the way. 6.84 ($684) profit realized in total by closing here. I'll look to re-up on weakness toward the bottom of the range with an accompanying pop in implied volatility.

Long | IWM AMEX:IWM
Possible Scenario: LONG
Evidence: Price Action, inverted hammer candlestick
TP1: 221$
Call options 20th Aug , strike 223$
*This is my idea and could be wrong 100%.

IWM short @ 224.22 I added to it todayDaily Stoch going up but look at VOL more selling buying
and Like I said it can rally to 100 or 50 day ma stop. look 4 lower highs
look daily candle doji on a rally into resistance and with a rally look vol RED today
Why did it rally shorts covering no new money big guys see what I see that weekly stoch heading down. TIP see the weekly stoch bottom one see how WIDE they are apart that says IWM FREAKING WEAK. Target 200 day ma 209

rsi platform used as springboard for higher prices in the pastbouncing off an elevated level(50) is usually bullish

IWM Heading to 200EMA?Sitting mid channel, a test of that support line will coincide with the 200EMA. A perfect combo and ultimately healthy for markets as a whole. Also interesting to note that IWM has not surpassed its highs hit in March unlike SPY, QQQ, and DIA. Last time this happened, was before the covid drop. Selling calls, buying puts, and/or adding stops a few BPS below trend would be smart protection in case we see something nasty. I and my firm are not expecting that. They recently updated end of year target price to 4600 on S&P 500. Another reason a normal pull back would be a healthy reset to power higher into end of year.

$IWM Heading for 200 EMA?Right in the middle of the channel. Will we see a drop to the 200EMA before bouncing and continuing higher?


Blood in the water for Russel 2000?Is this bubble about\ to pop over the next week? If it does I guess it will be epic.

8/2 IWM(1) pink trendline still a strong support to me (possibly entry zone)
(2) bullish to IWM after a short-term correction

Opening (IRA): IWM September 10th 203 Short Put... for a 2.02 credit.
Comments: Selling the 16 delta put in the expiry nearest 45 days until expiry to emulate dollar cost averaging into small caps. Generally, take profit on approaching worthless or take assignment of shares, sell call against.
Weekly Stoch TipSee how wide the stoch are on weekly .
That says downside pressure she gonna drop
Something I learned

IWM short @ 222.03Daily stoch going up so IWM going up but making lower highs lower lows and look VOL AND UNDER 50 AND 100 DAY MA.We have 3 lower highs on daily and that vol gonna fail. They can push it to 50 day 225 but that be it. IMHO
Weekly still heading down so with that weekly stoch heading down that downward pressure on stock so it will continue make lower highs, until u get that weekly turning up.

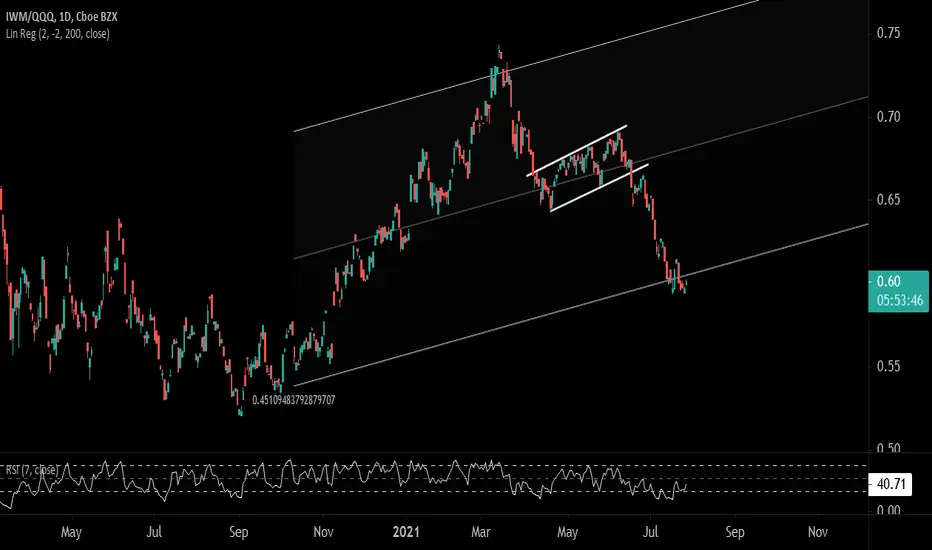
Pairs Trade Idea: Long Small Caps-Short Nasdaq 100 (IWM/QQQ)Looking at the relative ratio chart of IWM/QQQ, we note the price trading at the lower boundary of the linear regression channel, having recently completed it's bear flag formation. As a pair one could consider a long IWM ETF/short QQQ ETF, at current levels or better.
Current ratio: 0.60
Preferred buying range: 0.57-0.60
Stop: 0.54
Target Range: 0.65-0.67
$IWM AnalogIn this chart we analyze the relationship between the Small Cap iShares ETF and an analog of the 2002-2003 price action. From our view, we can see that we are clearly holding a similar pattern from back in the early part of that decade. This happened to be after a recession as well where the value/growth rotations were just as if not stronger than they are today. Something to keep in mind.
In short, we are bullish on the small cap sector from here. The risk reward is clear vs the recent range lows on the daily chart for a sustained move over the coming months higher.
