IWM Prefect example weekly stoch heading down and daily upLook daily going up the stoch
know look weekly heading down meaning any rally will fail and make lower highs as being shown in chart. See the daily both places it turned up and we made a lower high THAT WEEKLY RULES .
IWM trade ideas

IWM Buy Write IWM drop to start the week makes presents a buy write opportunity.
- Options expire in 4 days. 7/23 $210C @ $4.96 credit
- IWM @ $212.57
- Net purchase = $207.61 per share
If IWM closes above $210 = $239 in 4 days
If IWM closes below $210, my effective purchase price is $207.61. I would continue to sell Calls to collect premium.
IWM price is at support. I believe $205 is a key support level. Closing below $205 would indicate potential for further decline. As long as that price holds, I feel comfortable continuing to sell Calls and collecting premium credit.


Opening (IRA): IWM September 3rd 198 Short Put... for a 2.01 credit.
Notes: Doing my weekly, 16 delta short put in the broad market exchange-traded fund with the highest 30-day, which (no surprise here) is IWM for the umpteenth week running.


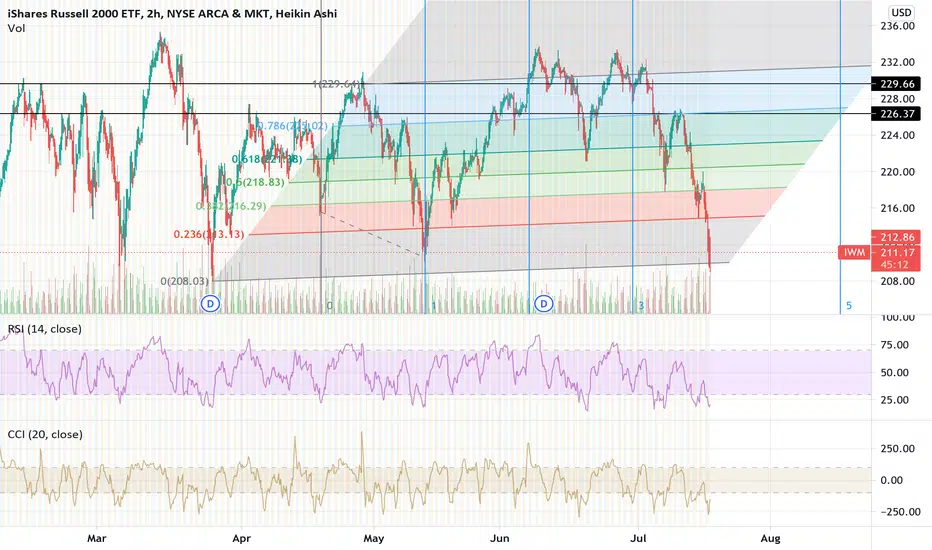
Hidden Divergence in IWM?MACD and MFI/RSI showing a hidden divergence. We may possibly have a reversion to the middle of the bollinger bands, but I wouldn't think it would be sustainable post short-term.


rangebound, looking to break lower which would drag everything IWM has been lagging and is looking to break out of the long term range we have been in for all of 2021. if it does it will drag everything down. but RSI and CCI both have come back from oversold so risk reward favouring upside, look for MACD crossover to confirm. Getting in too early is always a probelm, wait for confirmation.

Small caps testing a critical support levelSince 2005, the IWM/SPY ratio has held this key support level 6 times. This support failed only once, in the midst of the Covid-19 pandemic. Now we find out whether the pandemic was the exception that proves the rule, or whether the pandemic structurally changed something about the relationship between small caps and large caps.
Small cap valuations look better than large caps
Check out page two of the latest Yardeni report titled "Selected P/E Ratios." They've got forward P/E charts for large caps, mid caps, and small caps, showing that forward P/E for large caps is still extended well above its historical range, whereas forward P/E for small caps has corrected sharply down back into its normal range of the last 20 years. In fact, we're well below the price multiple that small caps traded at throughout 2017.
www.yardeni.com
Large caps just touched a strong resistance level
The Nasdaq index, heavily weighted toward large-cap tech stocks like Apple and Facebook, just touched 15,000 and seemingly got rejected from that level.
Large cap tech has benefited from soaring bond prices, but bonds seem to be meeting some resistance after this month's large inflation surprises. The Fed is doing its best to support bond prices with a "jawboning" campaign, but they've got a tough row to hoe after those inflation reports.
Large cap tech also faces a bipartisan push in Congress for antitrust legislation. Facebook, Apple, Amazon, Google, and Microsoft are among the names that may be affected if such legislation goes through. Of course, Tesla is also getting some bad press from the Solar City trial. So it's possible we will see the beginning of a real Nasdaq/S&P 500 correction here.
How I'm playing it
When I say I think small caps will hold this support, I don't necessarily mean that small caps will make gains. Only that they will make relative gains. That could happen by large caps and small caps selling off together, but small caps selling off more slowly. Or it could happen by small caps trading sideways as large caps sell off. In general, small caps have made their largest gains when large caps are going up, not when large caps are going down.
So one way to play this support level is with a two-tailed bet: long small caps, short large caps. Personally I am long a few select small cap names. I like Allison Transmission because of soaring car prices, and I like the KRE regional banking ETF because bonds look like they may have hit a ceiling, and because small lending banks tend to trade inversely with bonds. To hedge my rate bet, I'm also long on small cap gold miners, which should benefit if bonds continue to go up.
(I'm also long on homebuilders KB Home and MDC Holdings, although the homebuilder sector is struggling a bit due to backlogs, labor shortages, materials costs, buyer reluctance, and rising rates on 5/1 ARMs. I love the valuations on these two stocks, but I won't be surprised if that trade continues to go against me here.)
For the large cap short, I'm trying to be a little careful, because the big tech companies' earnings are coming up. I think I may wait to see what the results are before I take that leg of the bet. It would be easy to get wiped out by a big tech earnings beat. For now I've just grabbed some UVXY shares.
As always, this is just an idea and not investing advice. Good luck!

SHORT | IWM AMEX:IWM
Gap filled and it's time to going down,
Possible Scenario: SHORT
Evidence Price action
PUT options, 08/27/21, Strike 201$
TP1: 200 area.
*This is my idea and could be wrong 100%


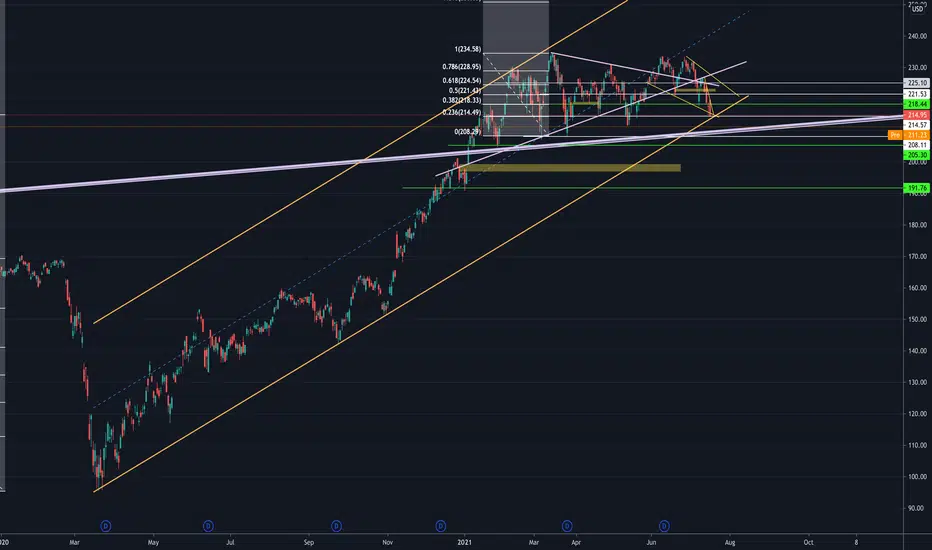
7/19 IWMIWM has already touched the support/bottom of the yellow tunnel,
next support I see~204 pink line for a rebounce

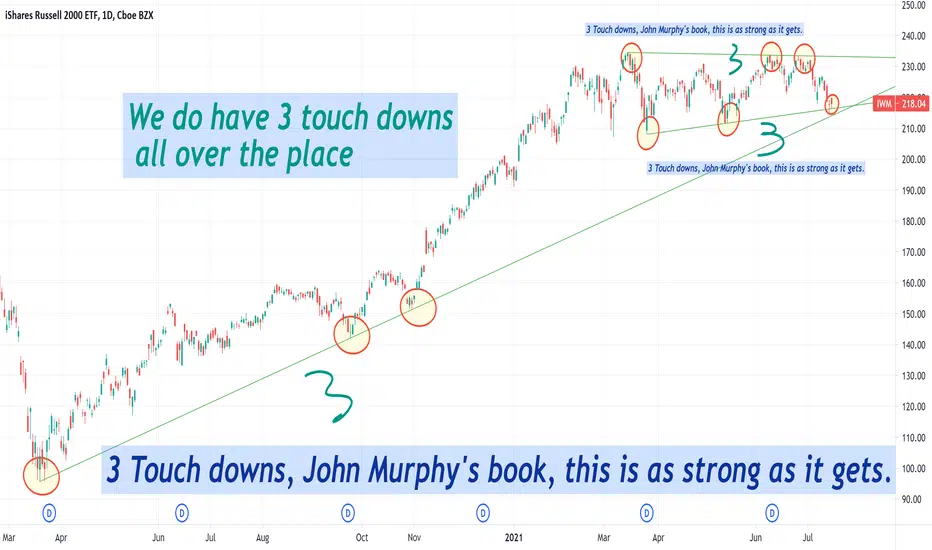
$IWM heavy distribution daysMultiple days of higher than average selling volume (red arrows) inside of $IWM base. This institutional selling is evident in the OBV breakdown well head of price. Needless to say, $IWM at an important juncture here. $SPY $QQQ

IWM Weekly Top?AMEX:IWM weekly looks very concerning as it may have formed a double top.
Last week's big down bar cut through the 20 EMA and the trendline. I expect more follow through to the downside in the near future.

Russell 2000: Bottom is in. Resting on two key supports.IWM is sitting at the confluence of a 6-month support trend line and a 16-month support trend line. Daily RSI is at its lowest level since March 24, just one day after the stock market bottomed following the corona virus crash. Primed for a bounce.


Opening (IRA): IWM August 27th 200 Short Put... for a 1.72 credit.
Notes: Selling 16 delta premium in the broad market instrument with the highest implied volatility in the contract nearest 45 days until expiry.

$IWM Has Four Buy IndicatorsFour buy indicators are:
1) SP on the bottom of the ascending channel
2) Volume spiked
3) Stochastic coiled and set to head up
4) RSI reflects oversold
A break tomorrow indicates a bearish correction, and we'll likely see a continuation down. If this level holds, we'll likely see $235+- possibly bouncing up to the top of the ascending channel.
I am LONG here and opened a position shortly after today's closing bell. I have a tight stop set up in case this level breaks to the downside.
