ES UpdateIndicators are neutral but MFI rapidly approaching overbought.
Quite frankly, I'm bearish on AAPL earnings this afternoon anyways
ESZ2016 trade ideas

Trading Plan for Thursday, May 2nd, 2024Trading Plan for Thursday, May 2nd, 2024
Market Sentiment: Uncertain, with bulls holding a precarious position at a critical support level.
Key Supports
Immediate Supports: 5048-50 (major - note that this trendline rises daily), 5032, 5028 (major)
Major Supports: 5010 (major), 4968 (major), 4938-42 (major)
Key Resistances
Near-term Resistance: 5077-82 (major), 5102 (major), 5126 (major), 5136 (major)
Major Resistances: 5155 (major), 5197-5202 (major), 5246-50 (major)
Trading Strategy
Critical Support Test: Vigilantly monitor the critical 5048-50 support zone for signs of breakdown or sustained defense.
Long Opportunities: Due to heightened volatility, avoid direct bids at support. Instead, prioritize failed breakdowns with flushes and reclaims for safer long entries, potentially around 5032 or 5028. In the event of a deep flush, consider knife-catches at major supports (5010, 4968, 4938-42).
Short Opportunities: Look for back-tests of 5126 and 5136 for shorts, but only if a strong bearish reaction to FOMC is evident. Proceed with caution.
Risk Management: Maintain disciplined risk management and tighter stops in this volatile period.
Bull Case
Holding Support: Defending the 5048-50 support zone is crucial. A failed breakdown with a quick reclaim above 5032-28 could trigger a move higher.
Reclaiming Resistances: Bulls need to push back to 5077-82, with a potential retest of that resistance, then onward to the 5126-36 zone for further confirmation and potential breakout.
Bear Case
Breakdown Signals: A convincing break below 5048-50 followed by a deeper dip through 5028 initiates the downside move. Watch for bounces/failed breakdowns for potential short entries.
News: Top Stories for May 2nd, 2024
Analysis of Stock Market Trends:
U.S. Market Performance: Mixed responses post-Fed's rate decision, with slight Dow increase and S&P, Nasdaq declines.
Interest Rates and Inflation Concerns: Persistent inflation shapes Fed policies, influencing market dynamics.
Sector-Specific Trends: Tech sector drives market, but faces valuation challenges and regulatory scrutiny.
Global Market Influences: European markets resilient; contrasting approaches to interest rates and inflation with the U.S.
Investment Strategies:
Federal Funds Rate Stability: Fed maintains high rate amid inflation concerns, impacting market expectations.
Inflation Trends and Policy: Slow decrease in inflation complicates rate cuts, influencing investment decisions.
Global Impact: Fed's policies affect global markets, especially in emerging economies and those tied to U.S. standards.
Long-term Considerations:
Geopolitical Tensions: Conflicts threaten global supplies; Middle East escalation could disrupt oil production.
Economic Slowdown: China's slowdown poses risks globally, impacting markets and economic stability.
Inflation and Interest Rates: Central banks balance inflation control without hindering growth, posing risks.
Technological Transformations: Rapid tech changes create opportunities and risks, transforming labor markets.
Environmental Risks: Growing environmental concerns pose economic consequences, impacting industries.

PacMan Trend Symbol; Guidance into PCE and Next WeekThe video explains it all a lot better, but basically, we are sitting with higher highs and lower lows on the trend timeframes that brought us here (30m-4hr), otherwise known as the Pac-Man symbol.
Trends into today are;
Last Macro Trend Signal Spots (ES Contract)
30m - 5083 Uptrend (4/25/2024) Higher High
1Hr - 5083 Uptrend (4/25/2024) Higher High
2Hr - 5131 Uptrend (4/25/2024) Higher High
3Hr - 5123 Uptrend (4/25/2024) Higher High
4Hr - 5131 Uptrend (4/25/2024) Higher High
6Hr - 5250 Downtrend (4/2/2024) Higher Low
12Hr - 5204 Downtrend (4/4/2024) Higher Low
Daily - 5166 Downtrend (4/12/2023) Higher Low
Weekly - 4769 Uptrend (12/11/2023) Higher High
Monthly - 5304 Uptrend (03/31/2024) Higher High
If we move directly higher from here, the 6hr is going to be a lower high, but it will be the lone trend calling for a lower movement, as when the 12hr and Daily strike, we will have a higher high.
I did not account for us to drop so harshly from GDP data yesterday, and certainly didn't expect that drop to fizzle out and us to push higher over after this occurred. This is why I almost never short into Earnings season.
Economic Calendar;
PCE Data is today. I foresee it pushing us lower, but not with enough confidence to blindly trade short into it.
Major next issue is the Fed Meeting on Wednesday of next week.
Overall, likely just missed opportunity from not going short at the close of Wednesday and catching most of the move back down yesterday, although I likely would have let at least half the profit reverse before I jumped out anyways.
I expect I'm going to miss out on a drop today, but without trend confirmation I just don't feel strongly enough about shorting into this PCE data at this point.
I made some good trades earlier, so I'm fine with it, and I still have Gold Long from 2305 and my Soy contracts are FINALLY starting to generate some revenue at around $1500 each.
Safe trading, and remember your risk management.

#ES_F Day Trading Prep Week 4.28 - 5.03Last Week :
Last week Globex opened inside the Value of 5086 - 4925 Range and right away found buying that started pushing us towards VAH. RTH gave us a push out of Value and holds above brought in more buyers to give us pushes to the Edge and attempts at Previous Ranges VAL/Value area but that move was sold back down towards the Edge and back under 5086 brought in the weakness needed to make a push back inside lower range towards VAH which looked promising for continuation since we were under Supply and under Settlement ranges but instead we failed to accept in Value pushed back to the Edge and end of day Spike pushed us over VAL where we spent Friday filling out that area of singles over VAL in a tighter distribution Range after failing to get back under 5112.05 - 07.50.
This Week :
Going into this week we have retail month end to finish up the month, we have new month starting and lots of data dropping this week as well. Our question this week is will we find acceptance back in this 5227 - 5066 Ranges Value ? are there actually bigger buyers in that Spike base to keep us up and start balancing here and continue filling out this VAL / Mean / VAH area ? Area over 5144 still has Single Prints above which are Supply and Volume trapped above them. Or maybe more selling will come in to give moves back under VAL to fill out that Spike Base to see if there are still buyers in that Edge or if we will start working our way under it towards the Value where we were able to transact through the whole thing and put in Time and Volume ?
Friday we tried to make a push over 5144 - 40.25 which was 5159 - 5107 Intrarange Resistance but failed the few attempts and stayed withing the ranges Mean of 5144 - 5125.
If we are to accept in this range and 5112.50 - 07.50 will keep acting as support then we can look to keep trading this current Intraday range of 5159 - 5107 and IF we continue holding over 5129 - 25 we could eventually get enough buying to try and fill out those single prints up to the Key Resistance. We would need to get through 5159.25 - 54.25 to see any higher prices with moves towards above VAH.
If the buying here is not strong and we just continue building up Supply around this current mean and can't fill the single prints up to the Key Resistance above or fill but fail to accept over then we can look for a return back towards the VAL and see a test of that 5112.50 - 07.50 area, if buying at that Spike base doesn't hold then we can see a move back towards the Edge to fill that Spike Base out and test the Edge again to see if there is still buying or if we will get back under the Edge and head for Previous Value.
With lots of news and data it could be a tricky week, Friday ended very slow after volatile action, will the slow theme continue this week ? If so need to be very patient letting things properly set up and show Failures or strength at levels before trying to catch the moves. Market is trying to find a range to start balancing in, I feel like 5086 - 4925 is the HTF Range market wants to be in and our destination is still lower but how fast or slow it will get moving there is the question and for now we are over the Edge which is telling us otherwise while we are inside 5182 - 15 Value... but just something to keep in mind if we don't find acceptance needed in here.
Levels to Watch :
Current Range 5159.25 - 5107.50
Key Levels for Continuation out 5159.25 - 54.25 // 5112.50 - 07.50
Means 5144 - 40.25 // 5129 - 25
If Accept Below Targets Spike Base and move back to Edge
Means 5095.50 - 92.50 // 5081 - 77.75
Key Area 5065.75 - 60.75
If holds current range and accepts over Key Resistance, above range is 5204.25 - 5154.25
Means 5188.25 - 84.50 // 5174.25 - 70.50
Key Resistance 5204.25 - 5199.75
IF Find ourself back under 5086 - 66 Edge watch out for continuation towards VAH / Mean and VAL of 5086 - 4925 Range.

ES Price Action REview FOMC 5-1-24Going over the FOMC reflecting on the day and our process. looking for clues to how we could have traded the day better. Better than yesterday is our only goal.

Time to catch its breathAfter the volatility seen on Wednesday in the S&P 500, the expectation is that Thursday will be a day for the market to catch its breath before labor numbers come out on Friday. This means trading inside Wednesday's range on Thursday.

S&P 500 Futures Fibonacci Analysis 050124Trading Idea
1) Find a FIBO slingshot
2) Check FIBO 61.80% level
3) Entry Point > 5107/61.80%
Chart time frame : B
A) 15 min(1W-3M)
B) 1 hr(3M-6M)
C) 4 hr(6M-1year)
D) 1 day(1-3years)
Stock progress : B
A) Keep rising over 61.80% resistance
B) 61.80% resistance
C) Hit the bottom
D) Hit the top
Stocks rise as they rise from support and fall from resistance. Our goal is to find a low support point and enter. It can be referred to as buying at the pullback point. The pullback point can be found with a Fibonacci extension of 61.80%. This is a step to find entry level. 1) Find a triangle (Fibonacci Speed Fan Line) that connects the high (resistance) and low (support) points of the stock in progress, where it is continuously expressed as a Slingshot, 2) and create a Fibonacci extension level for the first rising wave from the start point of slingshot pattern.
When the current price goes over 61.80% level , that can be a good entry point, especially if the SMA 100 and 200 curves are gathered together at 61.80%, it is a very good entry point.
As a great help, tradingview provide these Fibonacci speed fan lines and extension levels with ease. So if you use the Fibonacci fan line, the extension level, and the SMA 100/200 curve well, you can find an entry point for the stock market. At least you have to enter at this low point to avoid trading failure, and if you are skilled at entering this low point, with fibonacci6180 technique, your reading skill to chart will be greatly improved.
If you want to do day trading, please set the time frame to 5 minutes or 15 minutes, and you will see many of the low point of rising stocks.
If want to prefer long term range trading, you can set the time frame to 1 hr or 1 day.

sp500 shortmultiday short trade on sp500 . Tp at 4700
at the SP/VIX ratio, candle marked a bad bearish shadow, a hypothetical prelude to the formation of a bearish parallel channel. Possible index target 4700 points.

ES EOD UpdateWTF was that? LOL, Powell pump and dump in just one hour. I know I keep saying Fed days always whipsaw, but that was ridiculous.
Futures up a little on QCOM earnings, Europe might bounce overnight, sold of hard this morning, more whipsaw.
Anyways, it messed up the indicators, so no trading until things go overbought or oversold. Taking the rest of the week off.

ES UpdateRSI hit oversold at close yesterday, MFI still oversold.
Guessing we get a Powell pump this afternoon, but watch out for teh whipsaw

Bullish Setup Before The Fed?Looks like a bullish setup before the Fed. That being said, I think it could go either way.
Identifying opportunities on FOMC DayI go over how to establish potential scenarios for an FOMC day and how to prepare accordingly. FOMC can be very tricky to trade, but if you have a plan and know the levels that are in play it can provide great opportunities.

ES (S&P 500 Futures) continue with the Downtrend 👇On ES (S&P 500 Futures), it's nice to see a strong sell-off from the price of 5090 and 5128. It's also encouraging to observe a strong volume area where a lot of contracts are accumulated.
I believe that sellers from this area will defend their short positions. When the price returns to this area, strong sellers will push the market down again.
The downtrend combined with the strong volume area are my main reasons for this short trade.
Happy trading,
Dale

Trading Plan for Wednesday, May 1st, 2024Trading Plan for Wednesday, May 1st, 2024
Market Sentiment: Uncertain, with the potential for sharp swings amplified by the FOMC announcement. Increased caution and focus on capital preservation are paramount.
Key Supports
Major Supports: 5060 (major), 5043-47 (major), 5030-32 (major), 5000 (major)
Additional Supports: 4976 (major), 4938-41 (major)
Key Resistances
Near-term Resistance: 5066, 5077-82 (major), 5102 (major), 5144 (major)
Major Resistances: 5171 (major), 5200 (major), 5246-50 (major)
Trading Strategy
FOMC Volatility: Expect unpredictable price swings driven by reactions to the FOMC interest rate decision and related news.
Prioritize Capital Preservation: Focus on protecting your account rather than chasing aggressive moves. Adapt position sizing and risk management strategies accordingly.
Long Opportunities: Due to FOMC, direct bids are high risk. Focus on failed breakdowns for better risk/reward. Potentially long at major support levels after flushes and reclaims (5043-47, 5030-32).
Short Opportunities: Due to FOMC, direct shorts are also high risk. Watch for strong bounces and failed breakdowns. Consider shorts at key resistance levels only if the reaction to FOMC is definitively bearish. Proceed with extreme caution.
Level-to-Level Trading: Employ level-to-level scalping techniques and profit-taking, navigating this volatile environment with tighter stops.
Bull Case
Holding Support: Defending the 5043-47 support zone is crucial for bulls, with 5030-32 as the absolute minimum. Reclaiming resistances like 5066 could indicate buyer strength.
Bear Case
Breakdown Signals: A convincing break below 5030, intensified by negative FOMC news, signals a downside move. Watch for bounces/failed breakdowns for potential shorts.
News: Top Stories for May 1st, 2024
Global Economic Outlook
Mature economies are stabilizing with a slight growth uptick projected for 2024 and 2025.
Emerging economies maintain stability with growth projections at 4.3% for both 2024 and 2025.
Regional Trends
Asia, including China, anticipates a slowdown, while Latin America expects gradual growth increases.
Inflation and Monetary Policies
Global inflation is expected to decrease, reflecting central bank rate hikes for price stability and growth support.
Geopolitical Impacts
Populist policies and recent elections in the US and EU pose financial policy and market stability challenges.
Transition to a New Monetary Order impacts interest rates, asset values, and lending environments globally.
EU regulatory changes affect financial markets and trading regulations, emphasizing compliance.
Digital Transformation
Focus on digital assets and CBDCs outside the US signals shifts in financial transactions and regulations.
Blockchain technology enhances financial security and transparency, notably in DeFi platforms.
AI integration reshapes financial services, optimizing operations and decision-making processes.
Digital and open banking experiences exponential growth, fostering fintech innovations and collaborations.
RegTech solutions powered by AI help firms manage regulatory obligations efficiently across jurisdictions.

Prep and Lean ES/NQ/SPX Wednesday ES Trade Plan
Inflection: 5095
Upper lvls: 5115 / 5127 / 5137
Aggressive Inflection: 5076
Lower lvls: 5052-5056 / 5030-5038 / 5005
NQ Trade Plan
Inflection: 17628
Upper lvls: 17660 / 17776 / 17818-17838 / 17901-17937
Lower lvls: 17507 / 17356-17370 / 17283-17293 / 17163
SPX Pivot 5036
Stay Frosty!

ES1! morning updatePrice action in orange ellipse appears corrective, and in that light I feel more confident that the move from 5333.50 to 4963.50 was a complete impulse wave. From here, I see two possibilities: the bullish count (green) would have us at or near the low of today, with a move back up towards 5154.25 to complete a (B) wave; the bearish count (red) would have us continue lower today and break the low of 4963.50 with impulsive price action.

Overnight Price Action REview ES FOMC 5-1-24Going over price action for the ES. today is FOMC one of the most volatile days. size down manage risk today. we are going into battle soon.

SP500 - corrupt money supply - inflationThis ES1 chart is the six + Europe and Asia trading sessions.
this hasn't corrected properly in over a decade.... and this is what it looks like when they print trillions out of thin air, as "aid for Ukraine" which is then spent entirely on weapons or infrastructure supplied by our military industrial complex. we were warned about this shit. Orwell, Roosevelt.
BREAD, Circus, Genocide. thats a pretty clear indicator of how broken our government is. they show us Captain America and Captain Planet on the programming we got as kids... just an illusion to the reality of our criminal monetary systems and war mongering. all crimes against humanity, and sins of the soul that keep us trapped on these low vibrational levels.
Time to ascend. Time for the Ponzi scheme of the us financial markets, and now corrupted federal government to fall gracefully.
Teh SPX is long over due. the second leg down from covid is just now getting started... delayed by TRILLIOns of new money printed as stimulus. That is trillions stolen from all of us that have earned our money with our time and energy.
It flows through Ukraine, Israel, Palestine, and right back to the US stock market in the portfolio of the corrupt dudes that oppress the rest of us. inflated by blood money. and now tethered to BTC with the ETF.... poisoning that currency as well.
So.. time to pay the piper for all the money printing... the harmonics of the SPX suggest that we need to check in on the old resistance... now turned support, and 1600. bold white dotted line.
ps... BTC ETF + HALVING . . . is everyone just now figuring out "buy the rumor sell the news"
huge correction incoming.
Where will everyone put their credits with the US markets and BTC dumping???
sounds scary?!!? well, fear and greed are the dominant forces in these markets.
Hmmm... is there a coin that raises a different emotion??? maybe the emotion of Love? I know! DOGE coin. dogs are known for unconditional love. Love is the answer. love will prevail... im going that emotion moving forward. no more playing at the table with the blood money military complex sharks. im going to play at the table with all my friends. my tribe. the DOGE tribe.

SP500 & a corrupt money supplyThis ES1 chart is the six + Europe and Asia trading sessions.
this hasn't corrected properly in over a decade.... and this is what it looks like when they print trillions out of thin air, as "aid for Ukraine" which is then spent entirely on weapons or infrastructure supplied by our military industrial complex. we were warned about this shit. Orwell, Roosevelt.
BREAD, Circus, Genocide. thats a pretty clear indicator of how broken our government is. they show us Captain America and Captain Planet on the programming we got as kids... just an illusion to the reality of our criminal monetary systems and war mongering. all crimes against humanity, and sins of the soul that keep us trapped on these low vibrational levels.
Time to ascend. Time for the Ponzi scheme of the us financial markets, and now corrupted federal government to fall gracefully.
Teh SPX is long over due. the second leg down from covid is just now getting started... delayed by TRILLIOns of new money printed as stimulus. That is trillions stolen from all of us that have earned our money with our time and energy.
It flows through Ukraine, Israel, Palestine, and right back to the US stock market in the portfolio of the corrupt dudes that oppress the rest of us. inflated by blood money. and now tethered to BTC with the ETF.... poisoning that currency as well.
So.. time to pay the piper for all the money printing... the harmonics of the SPX suggest that we need to check in on the old resistance... now turned support, and 1600. bold white dotted line.
ps... BTC ETF + HALVING . . . is everyone just now figuring out "buy the rumor sell the news"
huge correction incoming.
Where will everyone put their credits with the US markets and BTC dumping???
sounds scary?!!? well, fear and greed are the dominant forces in these markets.
Hmmm... is there a coin that raises a different emotion??? maybe the emotion of Love? I know! DOGE coin. dogs are known for unconditional love. Love is the answer. love will prevail... im going that emotion moving forward. no more playing at the table with the blood money military complex sharks. im going to play at the table with all my friends. my tribe. the DOGE tribe.

Wednesday volatility is expectedWith the Fed making announcement on Wednesday, volatility would be expected in the S&P 500.
A change in the feds attitude towards interest rates being high longer is not expected.


ES daily Price Action Review 4-30-24Going over the days price action. looking for clues on how we could have traded the day better. always do your reflection period. without Reflection there is no Wisdom, only wasted time and time is something we just don't have a lot of. so Make it count. do the hard work.

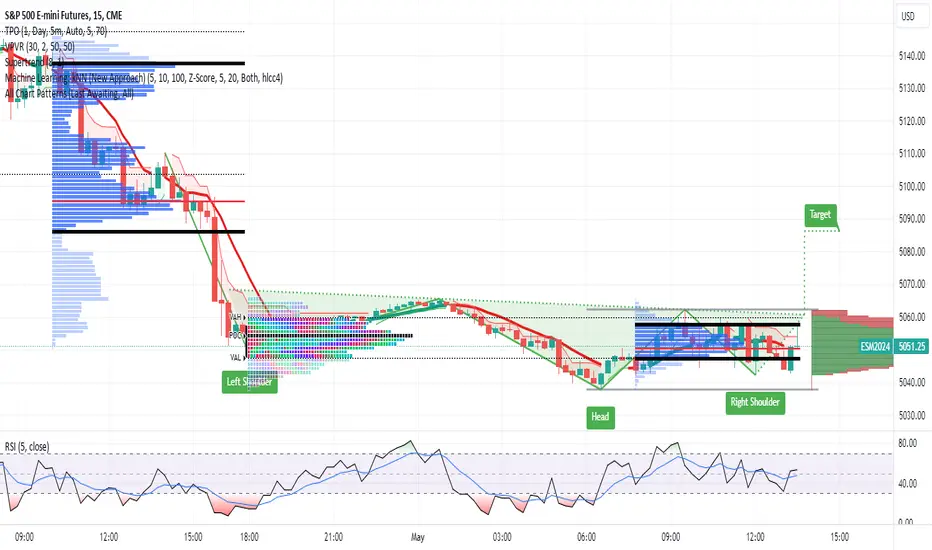
Long ON SP500 SP500 open with a gap down.
going for a long position before it continues its trend downwards.
Entry: 5052.25
Stop Loss: 5040.75
Depending on how movement is my first take profit is ( 5072.25 )
Full Take Profit: 5086.25
