Possible downward channel MESI like this look here on the 15 minute chart short at the top of this downward channel could bring in a nice bit of profit
ESZ2019 trade ideas

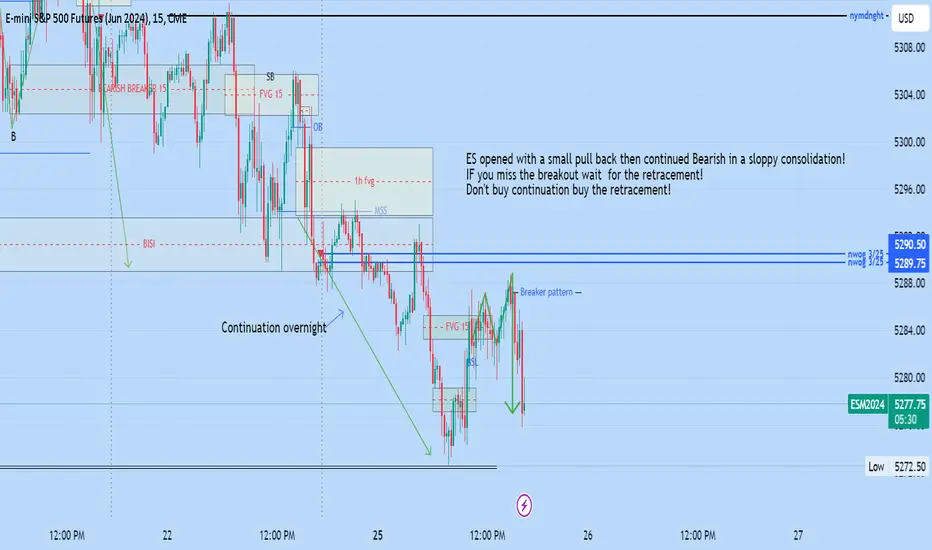
Wait for the retracementIf your late or miss the breakout be patience and wait for the retracement.
don't chase price.1

bullisj Shift in ESICT's Market Structure Shift
the shift is created by the when 2 short term lows (stl) form with an Intermediate low (itl) in between.
Anticipate higher prices.

NY AM Session Silver Bullet NY AM Session Silver bullet setup!
8:30 candle displaces creating a market structure shift
and creating a FVG on the 5 min chart.
Price then retest the 5 min. FVG (time distortion)
until 9:45 then displaces offering 10 handles.
Textbook 2022 model setup.

ES continues Bearish ES continued bearish after reaching the breaker target friday afternoon. NY AM session provided a retracement and another breaker for a late afternoon short.

compare two chartsThis is a tripple thrust pattern. After 5 waves UP, we get a series of lower highs, then a bear 5th wave down.

Trading Plan for Monday, March 25th, 2024Trading Plan for Monday, March 25th, 2024
Market Sentiment: Cautious, watching key support levels after the rally
Weekly Volatility Risk: High
Supports to Watch:
Immediate Supports: 5284-88 (major), 5276, 5259 (major), 5245-48 (major), 5236, 5230, 5219-21 (major), 5213, 5208, 5200-5197 (major), 5191, 5186, 5177, 5168-71 (major), 5163, 5155, 5145 (major)
Resistances to Monitor:
Key Resistances: 5295, 5302 (major), 5307 (major), 5313, 5320, 5328 (major), 5338, 5348 (major), 5355, 5363-66 (major), 5380, 5389, 5396-5400 (major), 5412, 5428 (major), 5438-42 (major), 5450, 5460-63 (major)
Trading Strategy:
Choppy Range: Be prepared for potential choppiness within the 5302-5288 range. Trade with caution and focus on range-bound strategies if this pattern persists.
Flag Structure: Observe the bull flag structure that has formed since Thursday. A decisive breakout or breakdown could provide a clearer directional signal.
Long Opportunities: Look for potential long entries at 5284-88, particularly after a retest and reclaim. If this level fails, be extremely cautious about longs and consider bids only at major support levels like 5259 and 5245-48 (triangle back-test).
Short Opportunities: Counter-trend shorting on strong up moves carries significant risk. Use extreme caution if considering shorts near major resistances. Watch for signs of a breakdown or retracement, and focus on 5307 and potentially 5348 if we get that far.
Focus on Reactions: Don't force trades, be patient, and react to price action. Let price discovery unfold after the rally.
Bull Case
Flag Breakout: A breakout above the bull flag resistance around 5307 could signal a continuation of the uptrend, targeting 5320, 5338, then 5348.
Support Holds: As long as 5284-88 holds as support, the bulls remain in short-term control. Look for potential add-on points if 5307 breaks out, preferably after acceptance or a failed breakdown.
Bear Case
Breakdown Signals: Breakdown below 5284 could trigger selling pressure. Watch for shorting opportunities on failed breakdowns or bounces. Exercise patience as these setups often involve traps.
News: Top Stories for March 25th, 2024
Federal Reserve Updates: Analysis of the Fed's latest interest rate decision, economic projections, and implications for future monetary policy. Focus on how market expectations for rate cuts in 2024 may have shifted, and the continued focus on inflation data.
Inflation and Economic Data: Discussion of the latest CPI figures, job market data, and their potential impact on the Fed's approach to managing inflation.
Market Reactions: Examine how global markets have reacted to the Fed's decisions, including equity indices, treasury yields, and the dollar's performance.
Global Economic Outlook: Updates from Vanguard on economic expectations, contrasting the U.S. with trends in the Eurozone and U.K.
Lessons from Bank Failures: Reflect on the lessons learned from recent stress in regional banks and discuss implications for the financial system's overall stability.
Energy Transition: Analysis of the challenges and opportunities in the electrification of energy markets.
Stock Market Sentiment: Review market sentiment after the Fed decision and the potential for near-term changes.
Remember: The market might be consolidating after a strong rally. Be adaptable, manage risk, prioritize capital preservation, and always prioritize reacting to price action over any predictions.

S&P Now Retraced 50% of the FOMC Breakout The index has now retraced 50% of the FOMC daily breakout... The 50-61% retracement is typically considered the buy zone.
Do buyers step in here, or will price offer a full retest of the prior breakout point near 5255?
That is the main watch early this week.

Buckle Your Seatbelt for a Market CorrectionCME: E-Mini S&P 500 Options ( CME_MINI:ES1! )
Last week, investors cheered as the Fed Chair reinforced that interest rate cuts are coming despite hot inflation readings in the last two months. For the full week, the Dow was up by nearly 2% in its best week since December 2023. The S&P was higher by 2.3% and the Nasdaq jumped 2.9%. The three major US stock indexes are on track to positive gains five months in a row.
Bull Market Carries on Despite Fed Hold
This is the fifth time that the Federal Reserve kept the Fed Funds rate unchanged at the 5.25%-5.50% range. The last of 11 consecutive rate hikes occurred in July 2023.
There are only eight FOMC meetings left in 2024. However, investors are pricing in at least three rate cuts by the end of the year.
According to CME Group’s FedWatch Tool, the probability of a 25-bp cut in June is 75.5%. There is a 77% chance that Fed Funds move to 4.50%-4.75%, indicating three rate cuts. Four rate cuts, which will be a full percentage point lower, is priced at 43% probability.
(Link: www.cmegroup.com)
Bullish investors pushed major assets up in the first three months of 2024:
• Bitcoin is up 48% year-to-date, while Ethereum is up 44%;
• S&P 500 gained 10.5% YTD, while Nasdaq 100 advanced 11.1%;
• Gold broke new record and was up 4.7% YTD;
• Dollar Index is up 2.2% YTD.
In my opinion, rate cut assumptions are too aggressive. This Fed is known to be highly data dependent. The Fed Chair had said that upticks of CPI data two months in a row did not change his assessment of inflation trending lower. However, if CPI continues to beat expectations, the Fed Chair may very likely correct his assumptions.
The timing of the first rate-cut is highly uncertain. CPI data in March could be a breaking point, setting the direction for interest rates for the rest of the year. Even if rate cut occurs as expected, the Fed would likely take it slowly, pausing to evaluate the lagging impact.
Therefore, the number of rate cuts could also be significantly fewer than market expectations. Recall that a few months ago, investors were pricing in six to eight rate cuts in 2024. Even though their expectations have been halved, I think they are still too aggressive. In my opinion, we could see one or two rate cuts this year. Any upticks in inflation could push rate cut into 2025.
Trading with E-Mini S&P Options
The Bureau of Labor Statistics (BLS) is scheduled to release March CPI data on April 10th. We could build an event-driven strategy focusing on this data release. If CPI data comes in strong, US stocks could face a major correction as investors lower their expectations for Fed cuts.
CME Group E-Mini S&P 500 Options provide leverage and capital efficiency. Options are based on futures contracts. Contract notional is $50 x S&P 500 Index.
On March 22nd, the June futures contract (ESM4) is quoted 5,289.75. The out-of-the-money (OTM) call strike 5,100 represents a 3.6% discount on the current market price. It is quoted at 63. To purchase put options, a trader would need to pay a premium upfront for $3,150 (= 63 x 50). Hypothetically, if the index moves down to 5,000, the put strike would be 100 points in-the-money (= 5100 – 5000). The trade will gain $5,000 (= 100 x 50). Considering the upfront premium, the theoretical return on our put strategy will be 58.7% (= 5000/3150 – 1).
If the market moves against the trade, with the index value staying above the strike, the trade will lose money, limited to the upfront premium.
Options traders could find CME’s Options Calculator a valuable tool in structuring their options strategies. The best part, it is free.
www.cmegroup.com
Happy Trading.
Disclaimers
*Trade ideas cited above are for illustration only, as an integral part of a case study to demonstrate the fundamental concepts in risk management under the market scenarios being discussed. They shall not be construed as investment recommendations or advice. Nor are they used to promote any specific products, or services.
CME Real-time Market Data help identify trading set-ups and express my market views. If you have futures in your trading portfolio, you can check out on CME Group data plans available that suit your trading needs www.tradingview.com

ES Weekly Levels (Mar25-28)Encouraged by a positive economic outlook and dovish signals from the FOMC, investors are diversifying beyond tech giants like NVDA & META. Confidence in the economy's resilience and the Fed's inflation management has broadened the market rally. Although the Mag 7 stocks continue to dominate XLF and XLE are near ATH and XLI remains strong. Small caps, which have lagged brutally look poised to play catchup. The SPX has gained 27% since late October, while NDX has gained 30%. We have a shorted trading week ahead with markets closed on Good Friday. Traders will look for clues for market direction from some Fed head speeches and PCE data at the end of the week
SUMMARY
ES posted a weekly gain of 2.05% after trading in a wide range of 141 pts.
ES recovered the previous 2 weeks losses with a 121 rally and made a new ATH.
R2 = ATH (5322)
R1 = HTF 1.13 Fib X (5294)
S1 = 9 ema (5247)
S2 = 21 ema (5198)
Bias remains long but potential for rejection at ATH and 1.13 Fib X
Break below upward trendline would signal potential trend change.
Positive reation to FOMC. Dovish Fed + OK economy
Mag 7 had strong week minus AAPL & TSLA
XLE & XLF near ATH and XLI continuing to showing strength.
All dips are being bought
Shortened trading week & end of month
PCE on Thurs/Fri
Small caps on breakout watch again
RSI 65.65| VIX at 13.05 | 10 year 4.20%

ES Bearish Breaker reaches initial target STD 1The ES bearish breaker pattern that setup during the PM NY session. Began its run down at 12:30 and continued into the close. After consolidating during the Asian and London sessions overnight. ES continued it's bearish run during the NY AM session offering 2 textbook ICT entries.
1st opportunity = OTE entry pattern. Entering the OTE strike zone @ 6:45 am and then offering a short for 17 handles.
2nd entry - ICT's 2022 model (silver bullet) during the NY am session. Price retraces the 6:30 run into the FVG at 9:30 am and runs down reaching the bearish breaker target of 5289. (offering 12 handles)

ES UpdateMFI heading down but RSI isn't moving much. That's an indication of a melt up. Closed my AAPL puts right after open, I was hoping for a gap down and didn't get it.
Anyways, just a dip today, and small caps made a much bigger dip. Will go long when MFI hits oversold, probably Monday

Trading Plan for Friday, March 22nd, 2024Trading Plan for Friday, March 22nd, 2024
Market Sentiment: Cautious, watching key support levels
Weekly Volatility Risk: High
Supports to Watch:
Immediate Supports: 5302 (major), 5298, 5286, 5282-79 (major), 5275, 5257, 5246-49 (major), 5236 (major), 5231, 5225, 5218 (major), 5212, 5208 (major), 5203, 5191-94 (major), 5179, 5169-71 (major), 5162, 5153-55 (major), 5147, 5136 (major), 5123-26 (major), 5115, 5108 (major), 5102, 5092, 5077-82 (major)
Resistances to Monitor:
Key Resistances: 5308, 5320 (major), 5331, 5337-39 (major), 5347, 5350-5354 (major), 5362, 5374, 5381, 5385-90 (major), 5400, 5413, 5425-30 (major)
Trading Strategy:
Support Testing: The market is likely to test key support levels after the rally. Prioritize capital preservation and be watchful for potential bounce plays.
Long Opportunities: Look for potential long entries at 5302 (after retest and reclaim), 5282-79, or the triangle backtest at 5246-49. Avoid aggressive longs if the triangle backtest fails.
Short Opportunities: Counter-trend shorting on strong up moves carries significant risk. Use extreme caution if considering shorts near major resistances. Watch for signs of a breakdown or retracement for better risk/reward entries.
Focus on Reactions: Don't force trades, be patient, and react to price action. Let price discovery unfold after the rally.
Bull Case
Triangle Backtest Hold: Bulls maintain control as long as the 5246-49 triangle backtest holds. A bounce here, particularly if it extends to the 5282-79 zone, provides a strong entry for a move back towards the 5320 resistance.
Basing and Building: Bulls could base above 5302 after a retracement, creating the potential for further upside moves. Watch for flagging in this zone for potential upside.
Bear Case
Breakdown Signals: Breakdown below 5302 and especially below the 5251-47 triangle backtest could trigger selling pressure. Watch for shorting opportunities on failed breakdowns or bounces. Exercise patience as these setups often involve traps.
News: Top Stories for March 22nd, 2024
Global Economic Developments: Labor market developments in Germany, housing market indicators in the U.S., the Panama Canal's financial performance, and the global semiconductor industry.
Federal Reserve Updates: The impact of the Fed's latest interest rate decision and economic forecasts.
Inflation and Jobs: Analysis of the latest job market data and inflation trends, and their implications for the Federal Reserve's future monetary policy actions.
International Markets: Updates on foreign direct investment in China, German business sentiment, inflation in Japan, and the Australian economy's response to interest rate pressures.
Legislative Updates (U.S.): Developments regarding the U.S. spending bill and geopolitical concerns surrounding the CHIPS grant in Arizona.
Indian Equity Markets: Analysis of recent movements in the Indian markets, including IT, auto sector news, and performance of the Sensex and Nifty.
Corporate News: Stock market reactions to company announcements, such as news from Larsen and Toubro and IDFC FIRST Bank. Outlook on Accenture and other tech stocks.
IPO and Stock Market Updates: Discussion of how Reddit's IPO performance may impact the overall market sentiment and encourage other companies to go public.
Remember: The market is likely in a price discovery phase. Be adaptable, manage risk, and react to price action rather than predicting.

MES SHORT POSITIONS Opened up three shorts earlier in the day and added three more two more times on the pullback

Key Daily Levels, ES SP-500 Futures March 22Context and Summary
The big move on Wednesday continued through into Thursday’s NY open, expanding further to Wednesday 1.414 fib expansion, 5322.50. The market hovered slowing advancing for another re-test of those highs, but after a failure to break IB high, the books quickly reverse and sellers stepped in to bring price down to the pre-market lows, with some intraday buyers showing a lack of conviction to hold.
The main thing to watch today is whether the market will pull back into Wednesday’s range, where there remains a lot of large gaps. There’s a big gap down to 5298, and the prior week highs are all the way down to 5257.
Overnight, UK Retail Sales numbers were released at 03h00 ET and that gave a big bump to the UK100 and SP500 ( CME_MINI:ES1! ), pushing price back up to the 0.50 level of the New York session trading range, 5211. The sales data show no significant change or declines in sales volume, which was a positive for retail sales companies. This was market by a very swift squeeze of short sellers which came into the market since the late Thursday afternoon.
Keep an eye on U.S. retail stocks at the open to see if they have follow through.
Global equities in Asia were weak, with Japan and China both retreating. This pulled down the appetite for risk assets GC BTC and SIL. CL is about flat today.
What to expect today?
For ES, the key levels to watch today will be the point of control, or the high volume nodes for Thursdays trading. It’s like price revisits liquidity at those levels, but if the selling continues, then 5311.25 (0.50 of prior day RTH) or 5316.00 (0.71) will become very strong selling walls.
If the buyers continue to hold the floor, 5299 to 5301, and we see an inside day, then possibly look for a sweep back up to 5320.00. If the buyers retreat and take profits, a bigger pullback may be likely given that the pop from Wednesday’s FOMC Interest Rate decision pushed price above 5297 and the market has not come back inside Wednesday’s range.
Above, look for a final exhaustion level of about 5228 or 5332, which is just above the 1.618 expansion of the weekly range from March 4-8th. This is also about 1.272 expansion of Thursday’s range.
Levels
5328 1.272 Prior Day RTH Expansion
5318 1.618 2-week range expansion
5332 1.414 expansion prior day RTH
5294.00 1.272 Prior Day RTH Expansion
5290 0.118 Wednesday RTH Retracement
5286 1.618 Prior Day RTH Expansion
Optimal sessions

Review of Levels, March 21 Thursday NY sessionReview of CME_MINI:ES1! Levels, March 21 Thursday NY session
Volume through the NY session was slow through the day, except for the wild swings at the open and late afternoon.
High of day "Premium"
On our daily 15m chart, I had this labelled as the daily premium (Purple Box), at the 1.414 Globex expansion levell above, and 1.272/1.414 expansion of prior day RTH. The high of the day held a few tests during the morning, The third tap of this level led to a reversal on the order books, as the market failed to break out of the initial balance high. That brough the price back down to the prior day RTH high (4pm price on Wednesday)
Low of day ""Support""
Price came back down to the 0.118 level for the high of day and prior day high. Later on in the day, it eventually came down to the support level at 5298 (prior day RTH high)
Strategies used
With relatively low volume during the session, deployed fib ladder, trading in-between each node (level) making it likely for moves between each level swift.
Footprint/deltas: reversal at IBH led to sweep of liquidity below to premarket lows.
Higher timeframe moving averages: 15m EMA held support all day until 1:05pm and the cross-under triggered sell volume
Higher timeframe Daily Fib Levels using Prior Day RTH range
Our result is +22 pts during regular session NY (from 9:30 to 2:00pm). I skipped 2:00-11:00pm.

ES potential for new highsGood Morning Traders,
Closures below 4200 invalidate ES to new highs.
potential reasons for this move:
- humans are like new things
- buyers outweighing sellers
-Stimulus Measures: Government and central bank stimulus programs can inject liquidity into the financial system and provide support to businesses and individuals. Continued fiscal and monetary policies aimed at promoting economic growth and stability may positively impact investor sentiment and drive stock prices higher.
-Market Sentiment and Investor Confidence: Investor sentiment plays a crucial role in stock market performance. If there is a widespread positive outlook, increased investor confidence can fuel buying activity and push stock prices higher. Factors such as low interest rates, positive earnings reports, and positive macroeconomic indicators can contribute to a bullish sentiment.
-Long-Term Growth Potential: The stock market is driven by long-term expectations and the underlying growth potential of companies. If there is optimism regarding the future prospects of businesses, investors may be willing to pay higher prices for stocks, leading to new market highs.

Melt up?I got this meltup target a while back listening to David Hunter in an interview. When I put it on my chart I was thinking it was unlikely but if you check the trend S&P will hit it middle of this year!

ES bearish breaker pattern ICT bearish breaker setup. best way to anticipate change in market delivery of price when trying to determine when price will change direction.

Still selling from new ATHs BearishI have studied all the timeframes, from 3 day to 3" we are going down off of a set of lower highs and lower lows, even though today was bullish I forsee selling down to 5153 oe even 5091 "1" and 1.618 fib extension.

ES1! afternoon updatePrimary bear count has wave C at or near completion, with upper limit of 5443.75 (white line) for the count to be valid. This would complete the B wave of an expanded flat that started January 2022.

S&P 500 June Futures Expecting a large downside to unwind and target 5120 level or below. which is a good liquidity pool resting downward and we have seen a nice market structure shift after taking out the buyside liquidity
