Algorithmic Precision with Average Range LevelsThis tool is just insane... it can tell you where you can expect High/Low of the DAY!
ESZ2016 trade ideas

$ES next bounce Next bounce at;
5530.25- 5526.75
Manage risk; a 15 min close below 5526.75
Reward; 8 ticks+

Morning Session Review ES 6-20-24Going over the Morning Session looking for clues as to what the market is telling us. focusing on our new trade rating system 1-10. 1 trade is impulsive not part of our plan. 10 is we found a trade that fit our trade plan, took action at appropriate time and managed per our system. keep working hard and never Quit.

ES Trade Plan, June 20thExcellent follow through from buyers. And this is charting 101. Tuesday here, I pshared that ES is bull flagging for rally to 5567, 5575, 5585-90. We just hit 85-90. All bonus now for buyers from here. As of now, 5575-76 (weak now), 5560-62 (weak) are supports. Buyers must hold above to keep 5595, 5610 in play . we sell if 5560 fails. CME_MINI:ES1!

ES Price action Review OverNight session 6-20-24going over the price action overnight and the holiday session from yesterday ES. looking for setups and basic plan for today.

ES analysis JuneteenthCME_MINI:ES1! NYSE is closed & ES closes at 1pm - no volume today, dont overtrade. Yesterday, ES was bull flagging to set up a push to 5564, 5575+. Patience paid & we hit 5564. Been basing here since. As of now: Lock in those gains here, hold runner and keep it a risk free day. 5560 is support. Keeps 5576-78, 5585+ in play. 5560 fails, dip to 5549

Quiet dayWith the holiday on Wednesday the expected price movement in the S&P 500 would be a quiet day. Not looking for dramatic volatility to the upside or to the downside without surprise news.

2024-06-18 - a daily price action after hour update - sp500Good Evening and I hope you are well.
sp500 e-mini futures
comment: Nothing fancy to report here either. Market is in balance and bulls poking at 5560. They want a break above for 5600 and will probably get it soon. Bears shorting the resistance at 5558ish and making money but will be quick to give up, if this trades above 5563/5565.
current market cycle: Max bullishness & peak bubble territory. Literally the peakiest of the peaks. Mother of all bubbles. Will end over the next weeks.
key levels: 5540 - 5600
bull case: Perfect buying at the 1h 20ema today for another ath 1 point above. Bulls want 5600 next. I leave room for 1 more leg up but that’s it. No more after that.
Invalidation is below 5540.
bear case: Bears need to stop the higher highs and trade below the 1h 20ema. Until they do that, max bullishness. Don’t make it more complicated. Can literally buy every pullback and make money.
Invalidation is above 5565.
short term: As bullish as one can be. Ride it up. 1 More leg possible to 5600 but that should be it.
medium-long term: Bearish. We will see 5000 over the next weeks again and 4600 over the next 12 months. Will update this time and price wise over the weekend but I expect to at least see 5000 over the next months in 2024. —updated weeks to months.
current swing trade: None
trade of the day: Buying 5543 or near the 1h ema or literally every 15m bear candle and scalp.

ES Price Action REview 6-18-24Going over the Price Action for the DAy ES looking for clues and what the market was trying to tell us. Wednesday market closed call up some of your buddies and enjoy the day off in the sun & the beach like me :)

E-mini S&P and E-mini NQ Actionable LevelsE-mini S&P (September) / E-mini NQ (September)
S&P, yesterday’s close: Settled at 5546.25, up 44.00
NQ, yesterday’s close: Settled at 20,192.75, up 247.25
Bias: Bullish/Neutral
Resistance: 5561*, 5577***, 5620.75**, 5762.75***
Pivot: 5542.75-5546.25
Support: 5533.25**, 5518.50-5521.75***, 5498.75-5503***, 5489.75-5492.75***
NQ (September)
Resistance: 20,271**, 20,532***, 21,410***
Pivot: 20,163-20,192
Support: 19,974-20,012**, 19,904-19,946***, 19,732-19,757****
*Trade ideas cited above are for illustration only, as an integral part of a case study to demonstrate the fundamental concepts in risk management under the market scenarios being discussed. They shall not be construed as investment recommendations or advice. Nor are they used to promote any specific products, or services.
Futures trading involves substantial risk of loss and may not be suitable for all investors. Trading advice is based on information taken from trade and statistical services and other sources Blue Line Futures, LLC believes are reliable. We do not guarantee that such information is accurate or complete and it should not be relied upon as such. Trading advice reflects our good faith judgment at a specific time and is subject to change without notice. There is no guarantee that the advice we give will result in profitable trades. All trading decisions will be made by the account holder. Past performance is not necessarily indicative of future results.

ES Day Trading Analysis With Volume ProfileOn ES , it's nice to see a strong buying reaction at the price of 5515 and 5499.
There's a significant accumulation of contracts in this area, indicating strong buyer interest. I believe that buyers who entered at this level will defend their long positions. If the price returns to this area, strong buyers will likely push the market up again.
The S/R zone from the past and high volume cluster are the main reasons for my decision to go long on this trade.
Happy trading
Dale

S&Pwhatever this is. S&P deez lines.
i'll chart anything. this is like my freecell or solitaire or sudoku candles up. candles down. x3 each chess. its like chess.
is there a minimum word count for these?
i'm gonna be ___ later if price doesn't at least touch one of these lines

Daily Recap & Small Account Challenge Day 25A recap of today's action, another strong day for bulls. New all time highs for the S&P and Nasdaq, with semis like AVGO leading the way. VX remained fairly strong today in my opinion, still watching it closely to see if it can get back over 14.35 or if it's time for more decay.

Daily REcap ES price Action Review 6-17-24Going over the price action ES for the day. looking back to how we could have traded it better and what to focus on for the next session.

ES - Weekly Forecast - 17 June 2024I have a bullish bias on the ES (e-mini sp500) for the next few weeks ahead
Buy entries and targets are in the video

ES1! - TIME TO LOOK FOR SHORT ENTRIES OPPORTUNITIES - WEEKLYThank you for the likes, shares and follows. Really appreciate!
_________________________________________________________
This is a zoome out from the latest analysis of the ES1! Mini S&P500 Market.
A little bit adjusted with some interesting points to consider.
in the upper side we potentially won't be surprised in proach futrue see the price rising to $5637.5.
It is time probably to think at holding long short positions as there are some potential lower price point interesting to consider:
- The red horizontal line range area
- And lower there the blue dashed horizontal line
next week candle could probably do the same as this week but in the short side.
Where is the price going and what is the upper side limit? We don't know, we can only make some assumptions based on the technical analysis of the chart.
The issue is that we see that some historicl correlations are not being respected anymore.

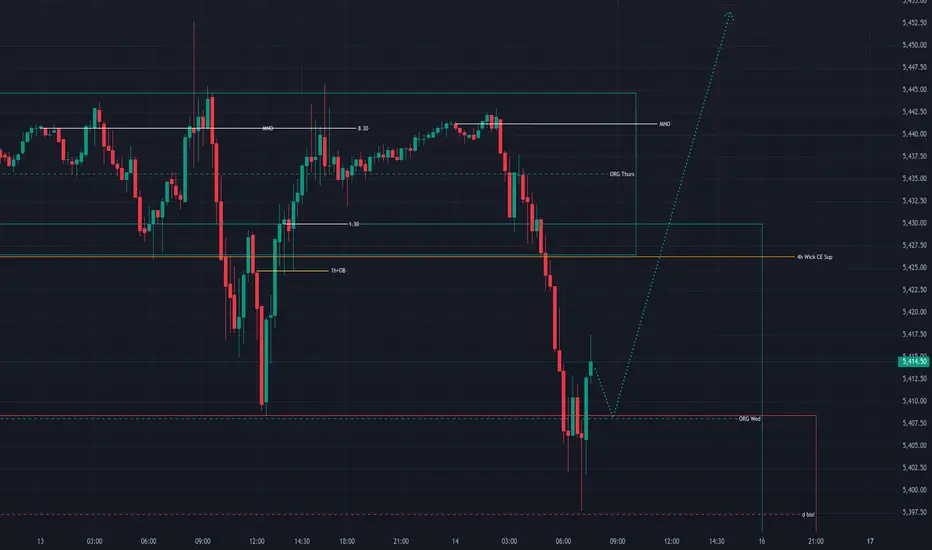
20240614 ESThere is the first +MSS after ss raid and reaction to the HTF PDA level (d bisi CE). => anticipate downside correction and displacement to the upside. Those close proximity highs are very attractive for the upside move and bs raid.
The HI news at 10am is the only thing that can make some unexpected change in this narrative with bullish BIAS.
It is possible to see the continuation of the upside move on the 10am HI news announcement. But some volatility influx is anticipated on this 10 HI new event.
$ES 8 tick scalp ideaEasy scalp idea;
Wait for 5503.75 then if needing to average down 5504.75. Go short here for an easy 8 tick bounce. On future funded accounts using 4 contracts you’ll make; $400 with 8 ticks.

Reviewing ES price action 6-13-24Going over the price action ES for Thursday. looking for clues as to what the market was telling us. how we could have traded better and how the Overnight session looks.

Reviewing ES price action 6-13-24Going over the price action ES for Thursday. looking for clues as to what the market was telling us. how we could have traded better and how the Overnight session looks.

PM Breaker Set up on the ESafter a nice Down leg in the NY AM Session the ES gave us a Bullish breaker setup and delivered 15 handles in the afternoon.
enter once price retraces into breaker box


Long $ES The only way I’ll touch NYSE:ES long is when it retest these levels. I’m fine missing a move. Willing to wait to minimize risk is the name of the game;
5444.75
5439.50
5426.25
5419.50
