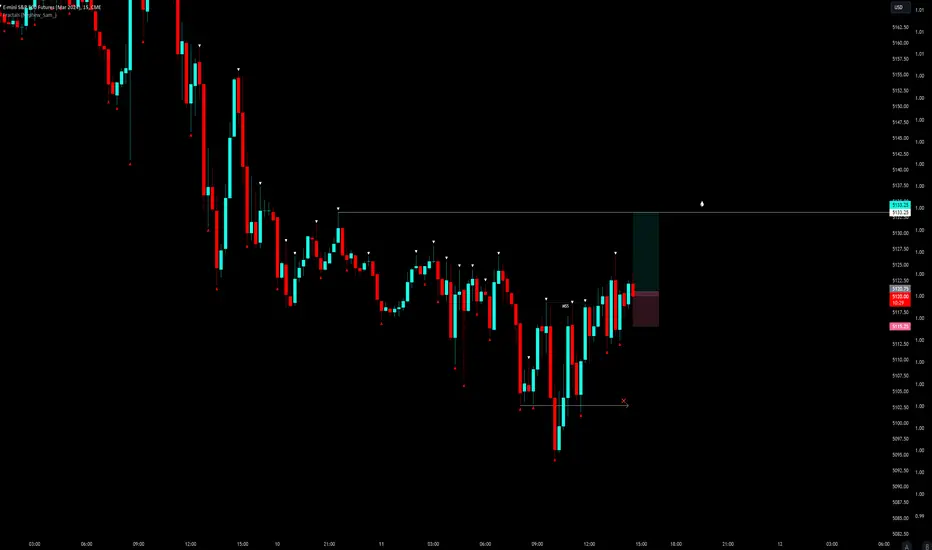
Long at retest of breakout pointAmazing how retests work even on data driven volatile days like today
Entry at the retest (purple arrow) yielded great results
ESM2016 trade ideas

S&P 500: Turn around! 🔄After the S&P was able to close the price gap of the previous trading week, bullish pressure pushed the index up again. We have drawn a clear demarcation between our two scenarios with the resistance at 5254 points. Primarily, we categorize the magenta wave (1) as finished. The current wave (2) correction should come to an end in our magenta Target Zone (coordinates: 4635 – 4340 points). If, on the other hand, the index surpasses the resistance level at 5254 points, the internal wave Alt.5 in turquoise as well as the superordinate magenta wave Alt.(1) will reach a higher level again. We assign a probability of 30% to this alternative scenario.


ES UpdateBad inflation news or not, the algos won't be denied, lol.
Expecting it to go overbought tomorrow, and reverse for a dip on Thu. I was busy doing other stuff and missed the pump, just staying cash. Would've been a lot easier if it the same thing as last month and gapped down big, this morning was a bit tricky, wasn;t sure what it was doing.

CPI Price Action Review ES Going over the price action on this CPI day. lots of setups executed very well. lots of levels and great moves. focus on your process. eliminate what doesnt work and double up on what works. always remember where you'll get out if you're wrong. we are Risk Managers.

ES UpdateMFI went oversold before market open, but RSI hasn't. MFI is a poor indicator for gap direction, gap will be dictated by CPI numbers premarket. Then we have PPI coming up on Thu.
ES is still in the channel though...

3/12 Tuesday Trading PlanTrading Plan for Tuesday, March 12th, 2024
Market Sentiment: Cautious
Weekly Volatility Risk: High
Supports to Watch:
Immediate Supports: 5181 (major), 5176, 5168 (major), 5163, 5155, 5149, 5140 (major), 5136, 5126 (major), 5115, 5110, 5103 (major), 5092-95 (major), 5082, 5077 (major), 5067, 5056, 5047, 5038-41 (major)
Resistances to Monitor:
Key Resistances: 5187, 5198, 5202 (major), 5212, 5220 (major), 5230, 5238, 5248-50 (major), 5262, 5267-70 (major), 5279, 5288-90 (major), 5297, 5305, 5314-16 (major), 5324, 5336 (major), 5344 (major)
Trading Strategy:
CPI Volatility: The recent CPI data release suggests hotter-than-expected inflation. Approach Tuesday's trading with heightened caution, reduced position sizes, and anticipate the potential for large swings and sudden reversals.
Re-evaluate Supports: The CPI data indicates increased potential for a more substantial market pullback. Reassess support levels and be prepared for potential breaks below the previously noted "major" levels.
Short-Term Bearish Tilt: Consider a short-term bearish bias for the day, prioritizing potential shorting opportunities on confirmed breakdowns below key supports or bounces off resistance levels.
Focus on Commodities: Pay close attention to commodities markets, specifically oil and food-related commodities, as recent price increases suggest further inflationary pressure.
Bull Case
Trend Defense: Bullish outlook remains plausible if 5181 and 5168 are defended. Holding these supports suggests a potential path towards resistances at 5203 and 5220.
Adding on Strength: Consider adding to long positions on reclaims of 5187, but proceed with extra caution ahead of potential further volatility.
Bear Case
Breakdown Risk: Breakdown below 5168-63 could signal a reversal. Look for bounces or failed breakdowns at these supports for potential short entries. Be aware that moves can be very rapid during high-impact news releases.
News: Top Stories for March 12th, 2024
Inflation Concerns Surge: The latest CPI data reveals higher-than-expected inflation readings, sparking concerns about persistent inflation and its impact on the Federal Reserve's plans for interest rates.
Market Volatility: Recent volatility underscores the sensitivity of the market to economic data and geopolitical events. Sectors like technology are drawing additional attention.
Cryptocurrency Market: Bitcoin and Ethereum prices are fluctuating, reacting to regulatory updates and news of institutional adoption.
Earnings Outlook: Stay attuned to corporate earnings for insights into how companies are navigating current economic challenges.
Geopolitical Impacts: Global tensions, notably the Ukraine-Russia conflict, are influencing commodity markets and overall sentiment.
Additional Factors: Keep an eye on M&A activity, economic indicators, tech regulation developments, sustainable investing trends, and evolving U.S.-China trade relations.
Remember: News-driven events like the CPI release can trigger significant short-term volatility. Stay flexible, be prepared to adapt, and prioritize preserving your capital.
Disclaimer: This analysis is for educational purposes only and is not financial advice. Always consult with a professional financial advisor before making trading decisions.

03/12 pre market planGood morning guys i havent been trading this days, a lot of study for that promotion keeps me out of the market some time, i had the inflation report in the pre market crazy movement as always, now we are rejecting the supply at 5145, honestly i would focus on shorts targeting the demand 5098 unless i see a lot of buying coming in.

REviewing Overnight Action ES Going over the price action overnight looking for clues the market is leaving us. not much to do really till CPI comes out at 0830. if its hot/cold we have a plan. going to react and not forecast. we are Risk Managers.

ES1! evening updatePrice action from 8 and 11 March looks corrective. If confirmed, I'm looking for daily higher-high to go no higher than 5394.75. Key supports are 4999.50 and 5129.50.

ES daily price Action rEviewGoing over ES price action for the day. Tomorrow is the CPI report critical for the market. next leg will depend on the results. great day today. great price action and great plan.

A neutral positionThe structure in the S&P 500 futures market with Friday and Monday's action is neutral as the market waits for the CPI number coming out on Tuesday. The overall bias for this market is still to the upside. It will be interesting to see can buyers follow through.

Morning Price Action REview ESgoing over the morning Price Action ES. looking for clues and which levels we need to engage in. took some TSLA, MRNA, RBLX, GOOGL, and looking to sell the miners on sell setups. no setup no trade. always know where you'll get out if you're wrong.


ES Trading Into Key AreaES currently trades into the near-term range VPOC - Range VPOC is always a strong level that traders should monitor the price reaction to. This area will be the main watch for today's session.

Overnight Price Action REview ESGoing over the ES overnight Price Action. looking for clues and trying to listen to what the market is trying to tell us. we did have some shorts in ES 2 pts from hitting our target. got out break even. no setup no trade is the motto for today.

3/11 Monday Trading PlanTrading Plan for Monday, March 11th, 2024
Market Sentiment: Neutral to Bullish
Weekly Volatility Risk: High
Supports to Watch:
Immediate Supports: 5196, 5187 (major), 5181, 5176, 5168 (major), 5163 (major), 5155, 5147, 5140, 5136, 5131, 5126 (major), 5116, 5108, 5103, 5095, 5090 (major), 5084 (major), 5076, 5072 (major).
Resistances to Monitor:
Key Resistances: 5205 (major), 5211, 5220 (major), 5232, 5241 (major), 5254, 5262 (major), 5270-73 (major), 5280, 5290 (major), 5296, 5309 (major), 5326, 5330 (major), 5348, 5359, 5366, 5377 (major)
Trading Strategy:
Cautious Trading: The early week dip suggests a more cautious approach for Monday's trading. Err on the side of capital preservation by limiting aggressive trades.
Long Opportunities: Look for potential long entries at major support levels, particularly 5187, 5168-63, and 5126.
Counter-trend Cautions: (For experienced traders) Be aware of potential short opportunities at resistances like 5262 and 5241, but remember the overall bull trend remains in force.
Bull Case:
Trend Continuation: The overall bull market is still dominant. Defending 5187 (and ideally 5163) supports would signal that another leg up is likely, targeting 5262+.
Adding on Strength: Monitor reclaims of 5211 for potential long entries.
Bear Case:
Breakdown Signals: A decisive break below 5187, particularly a failed breakdown, could trigger a move down the levels. Watch for shorting opportunities on confirmed breakdowns.
News: Top Stories for March 11th, 2024
Stock Market Strength: The S&P 500 continues its record-breaking run, with a strong 7.11% return year-to-date.
AI Drives Tech Boom: AI stocks, led by Nvidia's impressive earnings, are boosting the technology sector.
Fed Outlook: The Federal Reserve's plans for interest rates are a key focus as investors anticipate potential cuts in late 2024.
US Economic Picture: The latest GDP growth projections suggest a potential slowdown, but strong earnings and market momentum are positive indicators.
Global Outlook: The IMF's upward revision of global growth forecasts points to a return to normal growth levels.
Regulatory Updates: Fed officials are planning new rules to prevent banking crises, and the finalization of Basel III could have significant implications for the sector.
Additional Considerations:
Historical Trends: Historically, a strong January and February for the S&P 500 tend to foreshadow continued gains over the following 12 months.
Inflation Expectations: Monitor potential for a rebounding inflation rate later in the year.

Candle wicks signal failed breakdowns?Looks like a failed breakdown here? Bears may be trapped under the 5180 level
I am long at 5186

Options Blueprint Series: Straddle Your Way Through The UnknownIntroduction
Options trading offers a dynamic avenue for investors to navigate the financial markets, and among the myriad of strategies available, the Straddle strategy stands out for its unique ability to capitalize on market volatility without necessitating a directional bet. This article, part of our Options Blueprint Series, zooms in on utilizing Options on S&P 500 Futures (ES) to employ the Straddle strategy. The S&P 500 index, embodying a broad spectrum of the market, presents a fertile ground for options traders to implement this strategy, especially in times of uncertainty or ahead of major market-moving events.
Understanding S&P 500 Futures Options
Options on S&P 500 Futures offer traders and investors a versatile tool for hedging, speculating, and portfolio management. These options grant the holder the right, but not the obligation, to buy or sell the underlying S&P 500 Futures at a predetermined price before the option expires. Trading on the Chicago Mercantile Exchange (CME), these instruments encapsulate the market sentiment towards the future direction of the U.S. economy and stock market. Their popularity stems from the leverage they offer, alongside the efficiency and liquidity provided by the CME, making them an effective instrument for executing sophisticated strategies like the Straddle.
The Core of the Straddle Strategy
The Straddle strategy in options trading is a powerful method to exploit volatility. It involves simultaneously buying a call and put option on the same underlying asset, with identical strike prices and expiration dates. This non-directional strategy is designed to profit from significant price movements in either direction. For S&P 500 Futures options, this means traders can position themselves to benefit from market swings without trading the trends. The beauty of the Straddle lies in its simplicity and the direct way it captures volatility, making it a commonly used strategy in times of economic reports, earnings announcements, or geopolitical events that can trigger substantial market movements.
Executing the Straddle Strategy on S&P 500 Futures Options
Implementing a Straddle with S&P 500 Futures options involves a calculated approach. The first step is selecting the right expiration date and strike price, typically at-the-money (ATM) or near-the-market values of the ES options, to ensure a balanced exposure to price movements. Timing is crucial; initiating a Straddle ahead of anticipated volatility spikes can be more cost-effective, as option premiums tend to rise with increased uncertainty. Utilizing TradingView's comprehensive analysis tools, traders can gauge market sentiment, identify potential volatility catalysts, and choose the optimal entry points. Managing the trade requires vigilance, as the key to maximizing profits with a Straddle lies in the ability to respond adeptly to market shifts, possibly adjusting positions to mitigate risks or capture emerging opportunities.
Market Analysis for Straddle Execution
For a successful Straddle execution on S&P 500 Futures options, thorough market analysis is indispensable. Volatility, the lifeblood of the Straddle strategy, can be assessed using various technical indicators available on TradingView, such as the Average True Range (ATR) or the CME Group Volatility Index (CVOL). Economic indicators and scheduled events also play a crucial role. Traders should closely monitor the economic calendar for upcoming reports or news that could sway the market, adjusting their strategies accordingly. By analyzing past market reactions to similar events, traders can better predict potential price movements, enhancing their Straddle trade's effectiveness.
Implied Volatility and CVOL
Understanding Implied Volatility (IV) when trading Straddles is essential. IV reflects the market's expectation of a security's price fluctuation and significantly influences option premiums.
Since the S&P 500 Futures is a CME product, examining CVOL could provide an advantage to the trader as CVOL is a comprehensive measure of 30-day expected volatility from tradable options on futures which can help to understand if options are underpriced of overpriced at the time of the trade.
Strategic Risk Management for Straddle Trades
Risk management is paramount in options trading, especially with strategies like the Straddle that involve multiple option positions. Setting predefined exit criteria can help traders lock in profits or cut losses, ensuring that one side of the Straddle does not negate the other's gains. It's also vital to consider the time decay (theta) of options, as it can erode the value of positions as expiration approaches. Utilizing stop-loss orders or adjusting the Straddle to a more defensive setup, like transforming it into an Iron Condor, are ways to manage risk. Moreover, traders must keep an eye on liquidity to ensure they can adjust or exit their positions without significant slippage.
Case Study: Navigating Market Uncertainty with a Straddle on ES Options
Let's examine a hypothetical scenario where a trader employs a Straddle strategy on S&P 500 Futures options ahead of a potential major expected movement as the S&P 500 gaps up significantly after making a new all-time high which may lead to an unsustainable market condition. The trader selects ATM options with a 50-day expiration, expecting a sharp price movement in either direction.
Key S&P 500 Contract Specs
Tick Size (Minimum Price Fluctuation): 0.25 index points, equivalent to $12.50 per contract.
Trading Hours: Nearly 24-hour trading, starting from Sunday evening to Friday afternoon (Chicago times) with a 1-hour break each day.
Cash Settlement: No physical delivery of goods; contracts are settled in cash based on the index value.
Margin Requirements: Traders must post an initial margin and a maintenance margin, set by the exchange as a recommendation, to hold a position. These margins can vary based on market volatility and changes in the index value. Currently: $11,800 per contact.
Trading Venue: S&P 500 Futures are traded on the Chicago Mercantile Exchange (CME).
Access and Participation: Available to individual and institutional investors through futures brokerage accounts.
Leverage and Risk: Futures offer leverage, meaning traders can control large contract values with a relatively small amount of capital, which also increases risk.
Long Straddle Trade-Example
Underlying Asset: E-mini S&P 500 Futures (Symbol: ES1!)
Strategy Components:
Buy Put Option: Strike Price 5200
Buy Call Option: Strike Price 5200
Net Premium Paid: 195 points = $9,750
Micro Contracts: Using MES1! (Micro E-mini Futures) reduces the exposure by 10 times
Maximum Profit: Unlimited
Maximum Loss: Net Premium paid
Conclusion
The Straddle strategy, when applied to S&P 500 Futures options, offers traders a potent tool to potentially profit from market volatility without taking a directional stance. By understanding the nuances of the S&P 500 Futures options market, meticulously planning their Straddle setups, and employing rigorous risk management practices, traders can navigate the complexities of the options landscape with confidence. Continuous learning and practice, particularly in simulated trading environments, are essential for refining strategy execution and enhancing trade outcomes.
When charting futures, the data provided could be delayed. Traders working with the ticker symbols discussed in this idea may prefer to use CME Group real-time data plan on TradingView: www.tradingview.com This consideration is particularly important for shorter-term traders, whereas it may be less critical for those focused on longer-term trading strategies.
General Disclaimer:
The trade ideas presented herein are solely for illustrative purposes forming a part of a case study intended to demonstrate key principles in risk management within the context of the specific market scenarios discussed. These ideas are not to be interpreted as investment recommendations or financial advice. They do not endorse or promote any specific trading strategies, financial products, or services. The information provided is based on data believed to be reliable; however, its accuracy or completeness cannot be guaranteed. Trading in financial markets involves risks, including the potential loss of principal. Each individual should conduct their own research and consult with professional financial advisors before making any investment decisions. The author or publisher of this content bears no responsibility for any actions taken based on the information provided or for any resultant financial or other losses.

Possible period of acceptance here Price action is at an interesting juncture just below resistance from this morning's action and last Friday's close. If price was to sell down from here, I will be short at 5183

ES Failed Breakdown alertIf the failed breakdown is to play out, the trigger is the break of 5201 which is quite evident on the 2 hour chart.
You have to be stupid not to see it and equally stupid not to go long if it plays out.

Weekly price Action Review ESGoing over the weekly Price Action for the ES. sharing what we found with our scans and our plan for the next day or 2.
