ESH2025 trade ideas

AMP Futures - How to use Chart LayoutsIn this video we will demonstrate how to use Chart Layouts.
www.tradingview.com

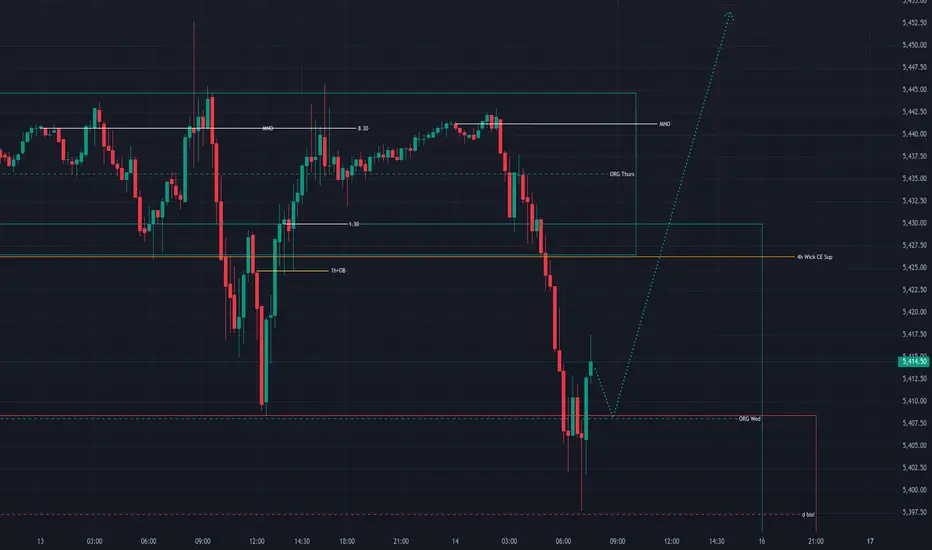
Now over $6k on this trade gave yall last week
Here is the FULL System for FREE
1 - Identify the FALSE breakdown or trap AKA double bottom
2 - Wait for the FVG to form to enter the trade
3 - To increase the win rate add the FIBONACCI tool and enter on the 618 within the FVG
Drop a LIKE For more FREE SYSTEMS AND TRADE IDEAS!

AMP Futures - Volume Footprint Chart typeIn this video we will demonstrate how to use the NEW Volume footprint chart type.

AMP Futures - Contract roll over using proper CQG symbol map.In this video we will demonstrate how to roll your contracts over using the proper CQG symbol map.

AMP Futures - New Volume Delta IndicatorsIn this video we will demonstrate how to access the New Volume Delta Indicators with TradingView.

Day Trade Using Event Contracts - E-mini S&P Futures Discover trading techniques with Anthony Crudele! 📈 Learn how to leverage CME Group's Event Contracts like 0DTE Options for day trading E-mini S&P Futures on the month's first trading day.

Options Blueprint Series: Secure Interest Rates with Box SpreadsIntroduction
The E-mini S&P 500 Futures is a popular and widely traded derivative product. These futures are used by traders and investors to hedge their portfolios, gain market exposure, and manage risk.
The Options Box Strategy is an advanced options trading technique that involves creating a synthetic long position and a synthetic short position simultaneously. This strategy is designed to lock in interest rates and profit from price discrepancies, essentially securing a risk-free return through arbitrage. By using Box Spreads, traders can secure interest rates and achieve a potential arbitrage opportunity in a controlled and predictable manner.
An interesting application of the Box Spread strategy is using unutilized capital in a trading account. Traders can earn a risk-free return on idle cash by deploying it in Box Spreads. This approach maximizes the utility of available capital, providing an additional revenue stream without increasing market risk exposure, thus enhancing overall portfolio performance.
E-mini S&P 500 Futures Contract Specifications:
Contract Size: $50 times the S&P 500 Index
Minimum Tick Size: 0.25 index points, equal to $12.50 per contract
Trading Hours: Nearly 24 hours a day, five days a week
Margin Requirement: $11,800 at the time of publishing this article
Micro E-minis: 10 times smaller than the E-minis
Understanding Box Spreads
A Box Spread is a sophisticated options strategy that involves simultaneously entering a long call and short put at one strike price and a long put and short call at another strike price.
Components of a Box Spread:
Long Call: Buying a call option at a specific strike price.
Short Put: Selling a put option at the same strike price as the long call.
Long Put: Buying a put option at a different strike price.
Short Call: Selling a call option at the same strike price as the long put.
How Box Spreads Secure Interest Rates: Box Spreads are designed to exploit mispricings between the synthetic long and short positions. By locking in these positions, traders can secure interest rates as the net result of the Box Spread should theoretically yield a risk-free return. This strategy is particularly useful in stable market conditions where interest rate fluctuations can impact the profitability of other trading strategies.
Advantages of Using Box Spreads:
Arbitrage Opportunities: Box Spreads allow traders to capitalize on discrepancies in the pricing of options, securing a risk-free profit.
Predictable Returns: The strategy locks in a fixed rate of return, providing certainty and stability.
Risk Management: By simultaneously holding synthetic long and short positions, the risk is minimized, making it an effective strategy for conservative traders.
Applying Box Spreads on E-mini S&P 500 Futures
To apply the Box Spread strategy on E-mini S&P 500 Futures, follow the following step-by-step approach.
Step-by-Step:
1. Identify Strike Prices:
Choose two strike prices for the options. For instance, select a lower strike price (LK) and a higher strike price (HK).
2. Enter Long Call and Short Put:
Buy a call option at the lower strike price (K1).
Sell a put option at the same lower strike price (K1).
3. Enter Long Put and Short Call:
Buy a put option at the higher strike price (K2).
Sell a call option at the same higher strike price (K2).
Potential Outcomes and Rate Security: The Box Spread locks in a risk-free return by exploiting price discrepancies. The profit is determined by the difference between the strike prices minus the net premium paid. In stable market conditions, this strategy provides a predictable and secure return, effectively locking in interest rates.
Advantages of Applying Box Spreads:
Risk-Free Arbitrage: The primary benefit is securing a risk-free profit through arbitrage.
Predictable Returns: Provides a fixed return, beneficial for conservative traders.
Minimal Risk: By holding both synthetic long and short positions, market risk is mitigated.
Considerations:
Ensure precise execution to avoid slippage and maximize the arbitrage opportunity.
Account for transaction costs, as they can impact the overall profitability.
Monitor market conditions to ensure the strategy remains effective.
Example Trade Setup:
Let's consider a practical example of setting up a Box Spread on the E-mini S&P 500 Futures while its current trading price is 5,531. We'll use the following strike prices:
Lower Strike Price (K1): 5450
Higher Strike Price (K2): 5650
Transactions:
Sell Call at 5650: Premium = 240.01
Buy Put at 5650: Premium = 352.85
Sell Put at 5450: Premium = 270.59
Buy Call at 5450: Premium = 347.39
Note: We are using the CME Group Options Calculator in order to generate fair value prices and Greeks for any options on futures contracts.
Net Premium Calculation:
Net premium paid = 347.39 - 240.01 + 352.85 - 270.59 = 189.64
Potential Profit Calculation:
Profit = (Higher Strike Price - Lower Strike Price) - Net Premium Paid
Profit = 5650 – 5450 – 189.64 = 10.36 points = $518 ($50 per point)
Rate Of Return (ROR) Calculation:
Margin Requirement = (Higher Strike Price - Lower Strike Price) × Contract Multiplier = 200 x 50 = $10,000
ROR = 518 / 10000 = 5.18%
Annualized ROR = 518 / 10000 x 365.25 / 383 = 4.94% (based on the screenshots, expiration will take place in 383.03 days while a year is made of 365.25 days)
Interesting Application: Utilizing Box Spreads with Unutilized Capital
An intriguing application of the Box Spread strategy is the use of unutilized capital in a trading account. Traders often have idle cash in their accounts that isn't actively engaged in trading. By deploying this capital in Box Spreads, traders can earn a risk-free return on otherwise dormant funds. This approach not only maximizes the utility of available capital but also provides an additional revenue stream without increasing market risk exposure. Utilizing Box Spreads in this manner can enhance overall portfolio performance, making efficient use of all available resources.
Importance of Risk Management
Risk management is a critical aspect of any trading strategy, including the implementation of Box Spreads on E-mini S&P 500 Futures. Effective risk management ensures that traders can mitigate potential losses and protect their capital, leading to more consistent and sustainable trading performance.
Conclusion
Implementing the Options Box Strategy on E-mini S&P 500 Futures may allow traders to secure interest rates and potentially achieve risk-free arbitrage opportunities. By understanding the mechanics of Box Spreads and applying them effectively, traders can capitalize on price discrepancies in the options market to lock in predictable returns.
Key points to remember include:
E-mini S&P 500 Futures offer accessible and efficient trading opportunities for both hedging and speculative purposes.
Box Spreads combine synthetic long and short positions, providing a powerful tool for securing interest rates through arbitrage.
By following the outlined steps and leveraging classical technical indicators, traders can enhance their ability to set up and analyze Box Spreads, making the most of this advanced options strategy.
Utilizing Box Spreads on E-mini S&P 500 Futures not only can secure interest rates but can also provide a structured and disciplined approach to trading, leading to more consistent and sustainable trading performance.
When charting futures, the data provided could be delayed. Traders working with the ticker symbols discussed in this idea may prefer to use CME Group real-time data plan on TradingView: www.tradingview.com This consideration is particularly important for shorter-term traders, whereas it may be less critical for those focused on longer-term trading strategies.
General Disclaimer:
The trade ideas presented herein are solely for illustrative purposes forming a part of a case study intended to demonstrate key principles in risk management within the context of the specific market scenarios discussed. These ideas are not to be interpreted as investment recommendations or financial advice. They do not endorse or promote any specific trading strategies, financial products, or services. The information provided is based on data believed to be reliable; however, its accuracy or completeness cannot be guaranteed. Trading in financial markets involves risks, including the potential loss of principal. Each individual should conduct their own research and consult with professional financial advisors before making any investment decisions. The author or publisher of this content bears no responsibility for any actions taken based on the information provided or for any resultant financial or other losses.

AMP Futures - Volume Candles Chart typeIn this video we will demonstrate how to access the NEW Volume candles chart type with TradingView.

AMP Futures - Time Price Opportunity (TPO) chart typeIn this video we will demonstrate how to access the NEW Time Price Opportunity (TPO) chart type using TradingView.

The Mechanics Of Trading - Part VI - 2 Min ES ChartPart VI
I started this video because a friend asked me for help determining trends on multi-interval (time frames) and asked how I look at trading across multiple intervals. Asking how to best setup/use price trends to capture the best trade setups.
Essentially, it comes down to three key components...
A. Initial reversal/impulse waves should be traded lightly (if at all). They are the "potential price reversal setups" that are usually the most dangerous for traders (and often fairly short in length).
B. Looking for the second wave to form provides traders with the opportunity to catch the bigger Wave-3. This wave forms after the impulse (Wave-1) and a corrective wave (Wave-2), which must stay below any previous ultimate high or above any previous ultimate low.
C. Wave-3, and Wave-5 if applicable, are where traders can flex their muscles related to trade size using the techniques I present to try to capture the MEAT (Sweet Spot) of any trend.
Remember, after Wave-3, you must prepare for the potential end of a trend setup where volatility is likely to increase and risks become a bit more elevated.
I go over multiple techniques in this video.
Fibonacci techniques and Fibonacci Price Theory
Anchor Bars (breakaway bars)
Using Fibonacci Retracements to identify key support/resistance levels for trending
Stochastics
RSI
Wave formations (ZigZag)
and Others
This video is designed as an instructional video to help you incorporate usable techniques into your own trading style.
Hope you enjoy.

Analysis for the Week of 06/03/2024 - SPY QQQ META COIN BTCA video going over my thoughts and expectations for the week, I'll continue to post ideas and updates as things develop throughout the week.

ES potential for new highsGood Morning Traders,
Closures below 4200 invalidate ES to new highs.
potential reasons for this move:
- humans are like new things
- buyers outweighing sellers
-Stimulus Measures: Government and central bank stimulus programs can inject liquidity into the financial system and provide support to businesses and individuals. Continued fiscal and monetary policies aimed at promoting economic growth and stability may positively impact investor sentiment and drive stock prices higher.
-Market Sentiment and Investor Confidence: Investor sentiment plays a crucial role in stock market performance. If there is a widespread positive outlook, increased investor confidence can fuel buying activity and push stock prices higher. Factors such as low interest rates, positive earnings reports, and positive macroeconomic indicators can contribute to a bullish sentiment.
-Long-Term Growth Potential: The stock market is driven by long-term expectations and the underlying growth potential of companies. If there is optimism regarding the future prospects of businesses, investors may be willing to pay higher prices for stocks, leading to new market highs.

ES - Weekly Forecast - 17 June 2024I have a bullish bias on the ES (e-mini sp500) for the next few weeks ahead
Buy entries and targets are in the video

ES1! - TIME TO LOOK FOR SHORT ENTRIES OPPORTUNITIES - WEEKLYThank you for the likes, shares and follows. Really appreciate!
_________________________________________________________
This is a zoome out from the latest analysis of the ES1! Mini S&P500 Market.
A little bit adjusted with some interesting points to consider.
in the upper side we potentially won't be surprised in proach futrue see the price rising to $5637.5.
It is time probably to think at holding long short positions as there are some potential lower price point interesting to consider:
- The red horizontal line range area
- And lower there the blue dashed horizontal line
next week candle could probably do the same as this week but in the short side.
Where is the price going and what is the upper side limit? We don't know, we can only make some assumptions based on the technical analysis of the chart.
The issue is that we see that some historicl correlations are not being respected anymore.

20240614 ESThere is the first +MSS after ss raid and reaction to the HTF PDA level (d bisi CE). => anticipate downside correction and displacement to the upside. Those close proximity highs are very attractive for the upside move and bs raid.
The HI news at 10am is the only thing that can make some unexpected change in this narrative with bullish BIAS.
It is possible to see the continuation of the upside move on the 10am HI news announcement. But some volatility influx is anticipated on this 10 HI new event.
$ES 8 tick scalp ideaEasy scalp idea;
Wait for 5503.75 then if needing to average down 5504.75. Go short here for an easy 8 tick bounce. On future funded accounts using 4 contracts you’ll make; $400 with 8 ticks.

Reviewing ES price action 6-13-24Going over the price action ES for Thursday. looking for clues as to what the market was telling us. how we could have traded better and how the Overnight session looks.

Reviewing ES price action 6-13-24Going over the price action ES for Thursday. looking for clues as to what the market was telling us. how we could have traded better and how the Overnight session looks.

PM Breaker Set up on the ESafter a nice Down leg in the NY AM Session the ES gave us a Bullish breaker setup and delivered 15 handles in the afternoon.
enter once price retraces into breaker box


Long $ES The only way I’ll touch NYSE:ES long is when it retest these levels. I’m fine missing a move. Willing to wait to minimize risk is the name of the game;
5444.75
5439.50
5426.25
5419.50

Long $ES The only way I’ll touch NYSE:ES long is when it retest these levels. I’m fine missing a move. Willing to wait to minimize risk is the name of the game;
5444.75
5439.50
5426.25
5419.50
