ESM2015 trade ideas

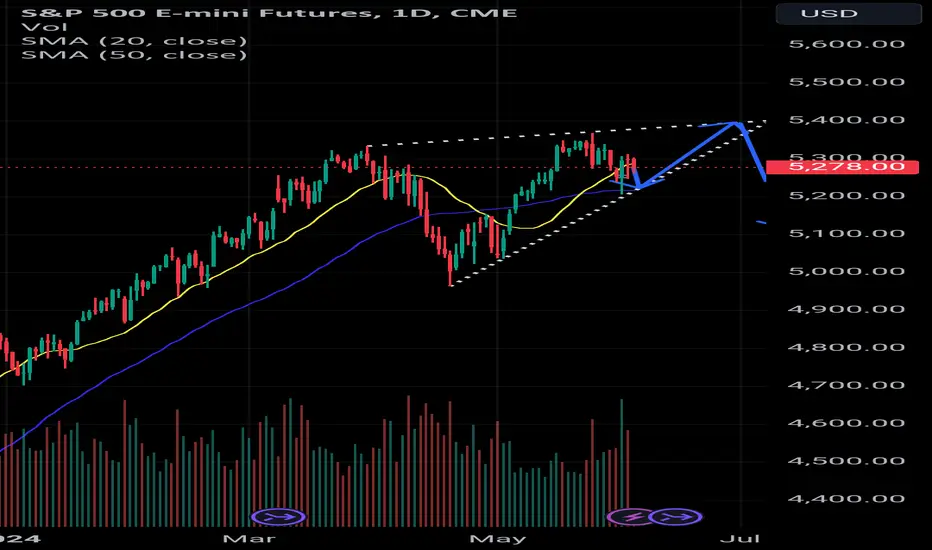
Rising wedge on the S&PWith the rejection of lower prices at the trend line, the S&P appears to be in a rising wedge at what I assume is the end of the uptrend. With FOMC meeting on the 12th, it could be the catalyst for more volatility. But with the VIX broken and a seemingly endless bull run, it is prudent to expect another wrench to be thrown into the fray before July. I'm watching for the pattern to complete by July 5th as of now.
Hey traders, it's Lord MEDZ here! In today's videoI'm excited to walk you through a fantastic trade I executed earlier on the Micro Nasdaq Futures (MNQ). Utilizing the ICT Fair Value Gap (FVG), Order Block (OB), and Market Structure Shift (MSS) strategies, I managed to achieve an impressive 11:1 risk-reward ratio within just 20 minutes, all during the New York power hour. We'll dive deep into the 15-second timeframe to break down every detail of this trade. Stay tuned to see how I leveraged these powerful tools to maximize my gains. Let's get into it!

ES1! afternoon updateThree examples of the .618 fib holding support since the low of 4963.50.
Bulls certainly seem intent on getting SPX to 6000. I think that as long as buyers are entering at and holding support at technical levels, no reason to doubt we see 6000 by the end of the year.

The Mechanics Of Trading - Part IX - ES Breakdown To SupportPart IX
I started this video because a friend asked me for help determining trends on multi-interval (time frames) and asked how I look at trading across multiple intervals. Asking how to best setup/use price trends to capture the best trade setups.
Essentially, it comes down to three key components...
A. Initial reversal/impulse waves should be traded lightly (if at all). They are the "potential price reversal setups" that are usually the most dangerous for traders (and often fairly short in length).
B. Looking for the second wave to form provides traders with the opportunity to catch the bigger Wave-3. This wave forms after the impulse (Wave-1) and a corrective wave (Wave-2), which must stay below any previous ultimate high or above any previous ultimate low.
C. Wave-3, and Wave-5 if applicable, are where traders can flex their muscles related to trade size using the techniques I present to try to capture the MEAT (Sweet Spot) of any trend.
Remember, after Wave-3, you must prepare for the potential end of a trend setup where volatility is likely to increase and risks become a bit more elevated.
I go over multiple techniques in this video.
Fibonacci techniques and Fibonacci Price Theory
Anchor Bars (breakaway bars)
Using Fibonacci Retracements to identify key support/resistance levels for trending
Stochastics
RSI
Wave formations (ZigZag)
and Others
This video is designed as an instructional video to help you incorporate usable techniques into your own trading style.
Hope you enjoy.

The Mechanics Of Trading - Part VIII - Learning PatiencePart VIII
I started this video because a friend asked me for help determining trends on multi-interval (time frames) and asked how I look at trading across multiple intervals. Asking how to best setup/use price trends to capture the best trade setups.
Essentially, it comes down to three key components...
A. Initial reversal/impulse waves should be traded lightly (if at all). They are the "potential price reversal setups" that are usually the most dangerous for traders (and often fairly short in length).
B. Looking for the second wave to form provides traders with the opportunity to catch the bigger Wave-3. This wave forms after the impulse (Wave-1) and a corrective wave (Wave-2), which must stay below any previous ultimate high or above any previous ultimate low.
C. Wave-3, and Wave-5 if applicable, are where traders can flex their muscles related to trade size using the techniques I present to try to capture the MEAT (Sweet Spot) of any trend.
Remember, after Wave-3, you must prepare for the potential end of a trend setup where volatility is likely to increase and risks become a bit more elevated.
I go over multiple techniques in this video.
Fibonacci techniques and Fibonacci Price Theory
Anchor Bars (breakaway bars)
Using Fibonacci Retracements to identify key support/resistance levels for trending
Stochastics
RSI
Wave formations (ZigZag)
and Others
This video is designed as an instructional video to help you incorporate usable techniques into your own trading style.
Hope you enjoy.

The Mechanics Of Trading - Part VII - 2 Min ES TrendingPart VII - Applying Success/Failure & Fibonacci Price Theory
I started this video because a friend asked me for help determining trends on multi-interval (time frames) and asked how I look at trading across multiple intervals. Asking how to best setup/use price trends to capture the best trade setups.
Essentially, it comes down to three key components...
A. Initial reversal/impulse waves should be traded lightly (if at all). They are the "potential price reversal setups" that are usually the most dangerous for traders (and often fairly short in length).
B. Looking for the second wave to form provides traders with the opportunity to catch the bigger Wave-3. This wave forms after the impulse (Wave-1) and a corrective wave (Wave-2), which must stay below any previous ultimate high or above any previous ultimate low.
C. Wave-3, and Wave-5 if applicable, are where traders can flex their muscles related to trade size using the techniques I present to try to capture the MEAT (Sweet Spot) of any trend.
Remember, after Wave-3, you must prepare for the potential end of a trend setup where volatility is likely to increase and risks become a bit more elevated.
I go over multiple techniques in this video.
Fibonacci techniques and Fibonacci Price Theory
Anchor Bars (breakaway bars)
Using Fibonacci Retracements to identify key support/resistance levels for trending
Stochastics
RSI
Wave formations (ZigZag)
and Others
This video is designed as an instructional video to help you incorporate usable techniques into your own trading style.
Hope you enjoy.

PUT Spread on /ES Neutral to Long strategy58 days out, Jul 26th
90% chance to win on this trade without needing to adjust
-4690 +4640 PUT side
$100 premium, $13 in fees, $697 capital allocated 12.4%
Will close around 50-70%
Next time doing one of these will aim for at least $100 post fees.

SP500**SP500:**
This week's forecast will be for the price to drop to the bottom of the channel and after that we'll have the scenario of the price continuing its descent to the 4,993 zone or reversing the trend and retesting the historical highs.

20240531 ESI anticipate more downside on 8.30 HI news, d ss raid and reversal to the upside for the rest of the day.

Overnight Price ACtion REview ESGoing over the price action Overnight ES looking for clues and what our plan for the day is.

ES1! big picture updateMy bullish count for ES1!. I have us in wave 3 of (5) of ((3)) of V.
It looks like wave 2 has completed. I expect ES1! to grind up the rest of the spring and summer, with target of ~6000 and the median line of the pitchfork drawn from COVID-19 low, January 2022 high and October 2022 low.

Small Account Challenge Day 14 Update - +$1,788, 675% SPX WinToday was great, had some awesome short setups earlier in the morning and I was able to capitalize. Thankful to have $3k profit after the first 14 days. I'll be taking MIL:1K out so I'll be trading with profits from now on.

S&P 500: Already reached the summit?According to our expectations, the overarching wave (1) in magenta should extend to a new record high. Only after this impulse do we anticipate an extended wave (2) correction. However, please note our alternative scenario (38% likely). This option will be triggered if the key 4964 level is breached and implies that the price is already in the correction.

Paths for ES Ahead of PCEI am bearish right now, but I went mostly cash before close yesterday. I'll trade the reaction in whatever direction that presents itself, but if ES can't hold 5240 and VX keeps moving higher I think ES.is headed to 5200 minimum.

Small Account Challenge Day 12 Update - +400% on IWM PutsHad the best day of the challenge so far and I'm hoping the momentum can continue into tomorrow.

S&P 500 (US500):🔴Bearish or bullish...?!🔴By examining the weekly and 4-hour charts, we can determine the price was heavily pushed down after creating the all-time high.
I am not bearish for the long-term on the S&P500, but for now, I think the price can have a bearish reaction to the bearish breaker block and move down at least till the previous week's low, then we should study the price to find out the next move.
💡Wait for the update!
🗓️27/05/2024
🔎 DYOR
💌It is my honor to share your comments with me💌

Prep and Lean ES/SPXES Trade Plan
Inflection: 5329
Upper lvls: 5345 / 5363 / 5370-5377
Lower lvls: 5309 / 5290-5297 / 5272
NQ Trade Plan
Inflection: 18933
Upper lvls: 18974-18982 / 19120 / 19148
Lower lvls: 18867 / 18787 / 18725 / 18621
Stay Frosty!

Trends still show upward movement; CPI Data this weekSo trends that called for upward movement confirmed this upward movement last week. I had mentioned in my last video that the candlestick pattern for May 1st was extremely bullish, the following two days confirmed that movement in my opinion and given that trends called for upward movement, we crossed above the zero line on MACD Momentum into a bullish zone, and we were pushing above that Daily lower high resistance level around 5160, I went long. I did cash that trade out around 5260 for a $5000 trade.
Given the uncertainty of how CPI could come in, I am likely to stick out until I see that data this Wednesday. While I'm not certain what Core CPI will do, and that SHOULD be the main data point we pay attention to, I have concerns based on a 10% hike in gas prices over much of April that Headline CPI could come in above expectations and cause at least an initial panic sell off.
We are nearing the potential for an overbought state on MFI/RSI on the daily, so watch for algo trading around those levels as well, at least on the initial touch. Obviously we rented living space in overbought territory at the beginning of this year, so it doesn't mean we have to reverse at all, especially in this FOMO market.
I continue to see the current conditions as very bullish, in spite of significant concerns I have for the ES Economy overall. While there was a time when the US Markets reflected the state of the US Economy, I think we have a massive disconnect between the two that was caused by the COVID Pandemic. I think the new trend is when the economy looks rough, dump money into Mag 7 / NYFAANG / or basically whatever hyper select group of stocks equals the majority of the market cap out there, which will just push markets higher in spite of economic conditions.
Walmart Earnings on Thursday will be something to watch, moreso as it might show insight into consumer health more than what is actually happening with Walmart.
Trends into today are;
Last Macro Trend Signal Spots (ES Contract)
30m - 5251 Uptrend (5/13/2024) Higher High
1Hr - 5241 Downtrend (5/10/2024) Higher Low
2Hr - 5229 Uptrend (5/9/2024) Higher High
3Hr - 5157 Uptrend (5/3/2024) Higher High
4Hr - 5148 Uptrend (5/3/2024) Higher High
6Hr - 5148 Uptrend (5/3/2024) Higher High
12Hr - 5188 Uptrend (5/6/2024) Higher High
Daily - 5166 Downtrend (4/12/2023) Higher Low
Weekly - 4769 Uptrend (12/11/2023) Higher High
Monthly - 5304 Uptrend (03/31/2024) Higher High
Economic Data;
PPI & Powell Speaking on Tuesday
CPI on Wednesday
Jobs data on Thursday
Earnings;
Home Depot Tuesday
Walmart on Thursday
Geopolitical;
Russia has had a major push into Ukraine, not sure it will matter but there is the potential for a major offensive to pick up pace there.
Israel / Hamas conflict continues to be a concern but doesn't seem to have much influence on markets at the moment.
Overall Sentiment;
Shorter Term - Neutral
Short Term - Neutral
Medium Term - Mmmm... really undecided on this one
Long Term - Bullish
Overall, I could see a quick pull back overall this week, but even if this happens I think the market will heal whatever dip we have and we will end higher overall by the end of next week.
Safe trading, and remember your risk management plan!

ES - One Step At A TimeWith 4 consecutive weeks of straight bullish price action, what would it take to slow down this bullet train?
I mean, it could go up forever but markets move in waves of fractals and retracement is perfectly healthy in a macro bull market.

Weekly Plan ES Futures - Week Of 5/27Weekly plan: ESH2024
NYSE:ES FUTURES 5/20/2024
5349 >> 5395 >>> 5439
Weekly pivot: 5308, Now 5333. Weekly Open 5322
5269>> 5216 >>> 5173

O DTE trade on /ES today-5270 +5255 / -5340 +5360
Huge fees on ES,$5 per leg, buying 2 contracts each leg to get premium over $100.
Could close early later today, or just let this play out.
Deltas are low atm: -5270 +5255 / -5340 +5360

SP500**SP500:**
New all time high at 5369.
The forecast is for the price to descend to the bottom of the channel and rise to make new all time highs.
