ESXEUR trade ideas

Sell Euro Stoxx This is just a journal for me. I strongly warn you to not take this in your real account. Good luck!

Euro Stoxx 50 - Daily - Daily - On stand byTrade Alert
If the index makes a further push higher and breaks above the 3185 level, this could mean that the index is ready to travel a bit higher, at least towards the highs seen during mid-November.
Alternatively, if Euro Stoxx 50 retraces back down and breaks below the very short-term tentative upside line, we could start targeting slightly lower levels again.
Please see the chart for details.
Don't forget your SL.
CFDs are complex instruments and come with a high risk of losing money rapidly due to leverage. 68% of retail investor accounts lose money when trading CFDs with the Company. You should consider whether you understand how CFDs work and whether you can afford to take the high risk of losing your money.

Euro Stoxx 50 - Daily - Stuck below key resistanceTrade Alert
This could be an interesting one to trade. Looking at where the index is right now, it's currently getting held by the resistance area between 3261 and 3275 levels. A nice good pop through the 3275 zone, could invite more bulls to the table and we could see Euro Stoxx 50 moving towards the next potential area of resistance at 3340, or even higher (please see the chart for details).
On the downside, from the short-term perspective, we could look at the 3197 level, as a potential breaking point for a continued move lower.
Please see the chart for levels.
Don't forget your SL


SX5E Approaching Resistance, Potential Reversal!SX5E is approaching its resistance at 3260 (100% Fibonacci extension, 50% & 38.2% Fibonacci retracement, horizontal overlap resistance) where it could potentially fall to its support at 3132 (61.8% Fibonacci extension, horizontal swing low support).
Stochastic (55, 5, 3) is approaching resistance at 97% where it could potentially reverse.

SX5E Bounced Off Support, Potential Rise!SX5E bounced off its support at 3088 (61.8% Fibonacci extension, 61.8% Fibonacci retracement, horizontal overlap support) where it could bounce up to its resistance at 3267 (50% Fibonacci retracement, horizontal overlap resistance).
Stochastic (55, 5, 3) bounced off near its support at 2%.


EUR50 target is 3039 level 17.942 % fibo. downtrend continueThe down trend based on fibonacci is 3039 (17.942%) . the trend changes if the market doesn't touch this level and passes 3222.

EU50EUR View -If the index breaks above the 38.2% Fibonacci at 3277,
-The next key resistance could arrive at the 50% Fibonacci at 3310.
-Further up, the 61.8% Fibonacci at 3344 is another important level to beat as this would open the way for the 50-day MA, currently around 3365.
- Climbing above the 50-day MA would help shift the near-term bias to a bullish one.
+However, failure to overcome the 38.2% Fibonacci would put the focus back to the downside, while immediate support is at 3235 then 3167
+


Stoxx50 Reversed Off Resistance, Potential Further Drop!Stoxx50 reversed off its resistance at 3281 (61.8% Fibonacci extension, 38.2% Fibonacci retracement, horizontal overlap resistance) where it could potentially fall to its support at 3196 (horizontal swing low support).
Ichimoku cloud shows signs of bearish pressure that contributes to our bearish bias.

SX5E Bounced Off Support, Potential Rise!SX5E bounced off its support at 3159.1 (100% & 61.8% Fibonacci extension, 50% Fibonacci retracement, horizontal overlap support) where it could potentially rise to its resistance at 3292.4 (50% Fibonacci retracement, horizontal pullback resistance).
Stochastic (55, 5, 3) is bounced off its support at 5.3% where a corresponding rise could occur.

The preponderance of evidence: SX5EThis is part of a series of charts which I will posting for the reader to make up his/her mind based on the weight of the evidence.
Do note, these are weekly charts which means the implications of which will occur over the next 12, 18, 24, 36 months.

Eurostoxx is showing signs of breaking downLast week I was cautiously optimistic that the EuroStoxx would move higher to 3500, and possibly break from there to complete the mini (inverted) head and shoulders that can be identified since the 30th October 2017. However this week's action adds to a more bearish, alternative path.
The blue support zone is a loosely defined price range of significance; this area has repeatedly acted as a support over the last 12 months. Since the January 2018 correction, all subsequent rallies from this range have failed. The index is now for the sixth time in this blue support zone. Moving averages, RSI and price are all negatively aligned.
Today's price movement is also completing a head and shoulders pattern that has developed since January 2017.

SX5E Bounced Off Near Its Support, Potential Rise!SX5E bounced off its support at 3275 (100% & 61.8% Fibonacci extension, 38.2% Fibonacci retracement, horizontal swing low support) where it could potentially rise to its resistance.
Stochastic (55, 5, 3) is approaching its support at 2.8%.

SX5E - Daily Key ElementsThese are the levels to look out for when analysing sx5e. Please refer to our 4hr chart for a strategic view!


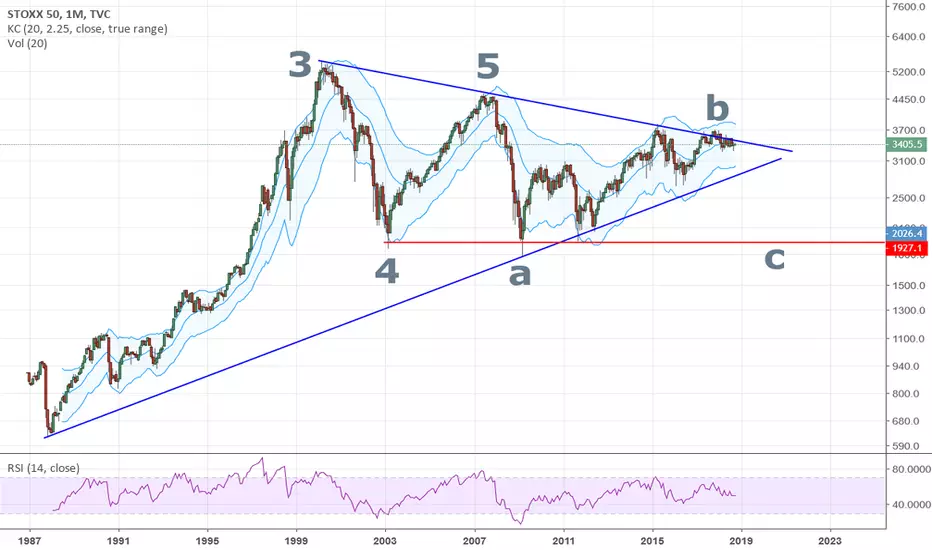
EURO STOXX downmoveA rapid decline mirroring the indicated a is to be expected after the trendline resistance did hold. Target may be around 20000.
Euro Stoxx 50 - Daily - Could still capture a bit of the upsideTrade Alert
We could still catch a bit of that uprise, especially if the index moves above its recent highs of 3436.5. The move could open the path towards the 3460 level initially and then maybe testing the long-term downside resistance line, taken from the highest point of January. This is where the price could stall for a while.
On the downside, a break below the 3405 zone, could set the stage for a possible drop down towards the 3350 area, which acted as good support on the 15th of August.
Always have your SL in place.

EU Stocks 50 Index - Bullish OpportunityWe can expect this EU Stocks 50 Index to continue it's bullish move up as soon as it breaks the 50 ema on the 4H timeframe chart.
20 EMA is the support and as long as it holds strong, this move is active.
Trade Safe.


