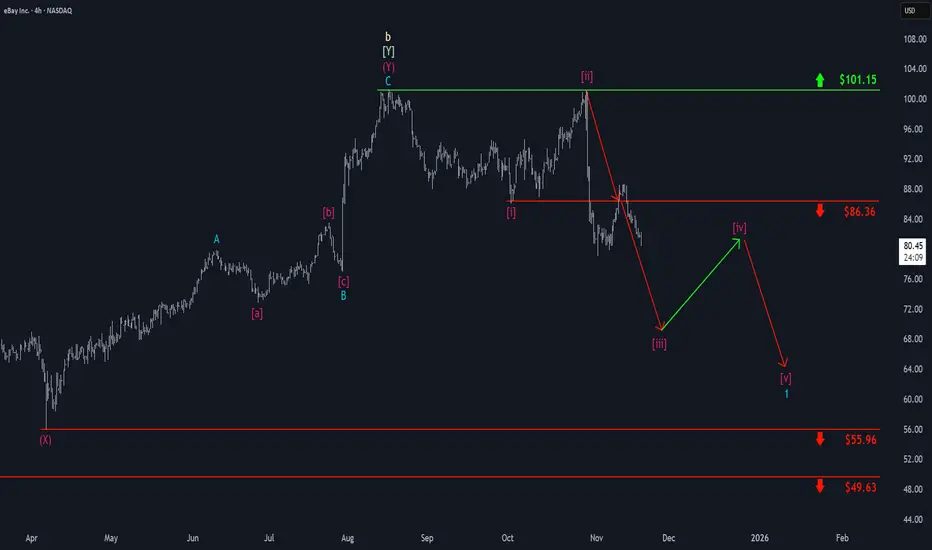
eBay - Breaking Down the StructureLet’s take a look at eBay stock from the very beginning up to today:
What do we see?
A completed wave structure and an almost completed Fibonacci structure as well.
The peak came in at 101 , which is close to the 105 Fibonacci level.
Now let’s zoom in on the larger fifth wave:
The mo
Next report date
—
Report period
—
EPS estimate
—
Revenue estimate
—
4.68 USD
1.98 B USD
10.34 B USD
450.49 M
About eBay Inc.
Sector
Industry
CEO
Jamie Iannone
Website
Headquarters
San Jose
Founded
1995
IPO date
Sep 24, 1998
Identifiers
3
ISIN US2786421030
eBay, Inc. operates as a commerce company. The company platforms include online marketplace and its localized counterparts, including off-platform businesses in South Korea, Japan, and Turkey, as well as eBay’s suite of mobile apps. The company technologies and services are designed to give buyers choice and a breadth of relevant inventory and to enable sellers worldwide to organize and offer their inventory for sale, virtually anytime and anywhere. The company was founded by Pierre M. Omidyar in September 1995 and is headquartered in San Jose, CA.
Related stocks

Mean Reversion Setup: EBAY1. RSI in oversold region
2. Price likely to rebound back to the mean
Trade Rules:
Entry Trigger - RSI has cross below oversold region, enter limit buy at close price
Exit Trigger - Close at market when close price cross above exit trigger (Red Line)
Notes: Maximum of 3 open positions

eBay: Progress!Recently, eBay has shifted upward and has achieved consistent gains since. We now consider waves C in green and b in orange as completed and expect an imminent arrival at our red Short Target Zone between $92.40 and $98.54. There, the orange three-part move is projected to complete blue wave (ii), a

EBay Bidders May Be ActiveEBay has squeezed into a tight range, but some traders may think the e-commerce stock is getting bid higher.
The first patterns on today’s chart are the price gap from October 30 and the October 10 weekly close of $88.55. EBAY has been trapped below both price areas and is now approaching them. Cou

EBAY retesting after breakout The stock is in a strong uptrend, using the 10MA 20MA as a reliable floor. Now the stock is testing all time high. Great time for entry. Stop loss would be breakdown on 50MA (75 USD).


eBay: Set for Further DeclineseBay has recently made another move higher, briefly reclaiming the $86.36 level. However, the stock has since resumed its downward trajectory as anticipated and is expected to continue selling off soon as part of magenta wave . Overall, this magenta downward impulse should push price closer to supp
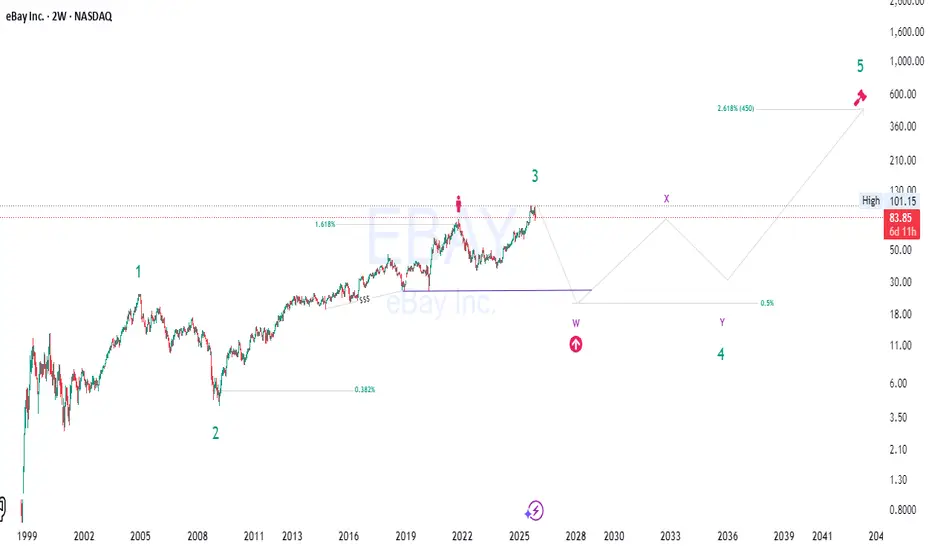
eBay’s Hidden Cycle | Correction Now, Explosion Next🔍 eBay (EBAY) – Full Spectrum Analysis
(Fundamentals + Elliott Waves + SMC + Market Structure + Fibonacci Confluence + Market Cycle)
eBay may be completing a major Wave 3 and entering a large corrective structure (W–X–Y) before a massive long-term Wave 5 rally toward the 2.618 extension
EBAY eyes on $80-81: Major Fib zone could mark a BOTTOMEBAY dropped hard from its last earnings report.
Now basing on a major support szone at $80.21-81.67
Look for a clean launch from here, stop loss just below.
.
See "Related Publications" for previous plots such as this PERFECT BOTTOM call:
Hit BOOST and FOLLOW for more such PRECISE and TIMELY ch

EBAY QuantSignals V3 Swing 2025-11-05EBAY QuantSignals V3 Swing 2025-11-05
EBAY Swing Signal | 2025-11-05
• Direction: BUY PUTS | Confidence: 60%
• Horizon: 16 days to 2025-11-21
• Strike Focus: $80.00
• Entry Range: $1.81
• Target 1: $2.70
• Stop Loss: $1.30
• 1W Move: -0.71%
• 2W Move: -10.78%
• Volume vs Prior Swing: 1.6×
• Swing Ra

See all ideas
Summarizing what the indicators are suggesting.
Neutral
SellBuy
Strong sellStrong buy
Strong sellSellNeutralBuyStrong buy
Neutral
SellBuy
Strong sellStrong buy
Strong sellSellNeutralBuyStrong buy
Neutral
SellBuy
Strong sellStrong buy
Strong sellSellNeutralBuyStrong buy
An aggregate view of professional's ratings.
Neutral
SellBuy
Strong sellStrong buy
Strong sellSellNeutralBuyStrong buy
Neutral
SellBuy
Strong sellStrong buy
Strong sellSellNeutralBuyStrong buy
Neutral
SellBuy
Strong sellStrong buy
Strong sellSellNeutralBuyStrong buy
Displays a symbol's price movements over previous years to identify recurring trends.
US278642AF09
eBay Inc. 4.0% 15-JUL-2042Yield to maturity
5.70%
Maturity date
Jul 15, 2042
US278642AZ6
eBay Inc. 3.65% 10-MAY-2051Yield to maturity
5.67%
Maturity date
May 10, 2051
EBAY6224154
eBay Inc. 5.125% 06-NOV-2035Yield to maturity
5.14%
Maturity date
Nov 6, 2035
EBAY5500361
eBay Inc. 6.3% 22-NOV-2032Yield to maturity
4.69%
Maturity date
Nov 22, 2032
US278642AY97
eBay Inc. 2.6% 10-MAY-2031Yield to maturity
4.49%
Maturity date
May 10, 2031
US278642AX1
eBay Inc. 1.4% 10-MAY-2026Yield to maturity
4.29%
Maturity date
May 10, 2026
EBAY4962298
eBay Inc. 2.7% 11-MAR-2030Yield to maturity
4.27%
Maturity date
Mar 11, 2030
EBAY6224153
eBay Inc. 4.25% 06-MAR-2029Yield to maturity
4.13%
Maturity date
Mar 6, 2029
US278642AU7
eBay Inc. 3.6% 05-JUN-2027Yield to maturity
4.04%
Maturity date
Jun 5, 2027
EBAY5500360
eBay Inc. 5.95% 22-NOV-2027Yield to maturity
3.95%
Maturity date
Nov 22, 2027
See all EBAY bonds
Frequently Asked Questions
The current price of EBAY is 82.88 USD — it has increased by 0.14% in the past 24 hours. Watch eBay Inc. stock price performance more closely on the chart.
Depending on the exchange, the stock ticker may vary. For instance, on NASDAQ exchange eBay Inc. stocks are traded under the ticker EBAY.
EBAY stock has fallen by −6.44% compared to the previous week, the month change is a −3.60% fall, over the last year eBay Inc. has showed a 22.21% increase.
We've gathered analysts' opinions on eBay Inc. future price: according to them, EBAY price has a max estimate of 115.00 USD and a min estimate of 65.00 USD. Watch EBAY chart and read a more detailed eBay Inc. stock forecast: see what analysts think of eBay Inc. and suggest that you do with its stocks.
EBAY reached its all-time high on Aug 15, 2025 with the price of 101.15 USD, and its all-time low was 0.44 USD and was reached on Oct 8, 1998. View more price dynamics on EBAY chart.
See other stocks reaching their highest and lowest prices.
See other stocks reaching their highest and lowest prices.
EBAY stock is 6.94% volatile and has beta coefficient of 0.43. Track eBay Inc. stock price on the chart and check out the list of the most volatile stocks — is eBay Inc. there?
Today eBay Inc. has the market capitalization of 39.54 B, it has increased by 0.85% over the last week.
Yes, you can track eBay Inc. financials in yearly and quarterly reports right on TradingView.
eBay Inc. is going to release the next earnings report on Feb 25, 2026. Keep track of upcoming events with our Earnings Calendar.
EBAY earnings for the last quarter are 1.36 USD per share, whereas the estimation was 1.33 USD resulting in a 1.95% surprise. The estimated earnings for the next quarter are 1.35 USD per share. See more details about eBay Inc. earnings.
eBay Inc. revenue for the last quarter amounts to 2.82 B USD, despite the estimated figure of 2.73 B USD. In the next quarter, revenue is expected to reach 2.88 B USD.
EBAY net income for the last quarter is 632.00 M USD, while the quarter before that showed 368.00 M USD of net income which accounts for 71.74% change. Track more eBay Inc. financial stats to get the full picture.
Yes, EBAY dividends are paid quarterly. The last dividend per share was 0.29 USD. As of today, Dividend Yield (TTM)% is 1.33%. Tracking eBay Inc. dividends might help you take more informed decisions.
eBay Inc. dividend yield was 1.74% in 2024, and payout ratio reached 27.40%. The year before the numbers were 2.29% and 19.26% correspondingly. See high-dividend stocks and find more opportunities for your portfolio.
As of Feb 12, 2026, the company has 11.5 K employees. See our rating of the largest employees — is eBay Inc. on this list?
EBITDA measures a company's operating performance, its growth signifies an improvement in the efficiency of a company. eBay Inc. EBITDA is 2.67 B USD, and current EBITDA margin is 25.64%. See more stats in eBay Inc. financial statements.
Like other stocks, EBAY shares are traded on stock exchanges, e.g. Nasdaq, Nyse, Euronext, and the easiest way to buy them is through an online stock broker. To do this, you need to open an account and follow a broker's procedures, then start trading. You can trade eBay Inc. stock right from TradingView charts — choose your broker and connect to your account.
Investing in stocks requires a comprehensive research: you should carefully study all the available data, e.g. company's financials, related news, and its technical analysis. So eBay Inc. technincal analysis shows the strong sell today, and its 1 week rating is sell. Since market conditions are prone to changes, it's worth looking a bit further into the future — according to the 1 month rating eBay Inc. stock shows the buy signal. See more of eBay Inc. technicals for a more comprehensive analysis.
If you're still not sure, try looking for inspiration in our curated watchlists.
If you're still not sure, try looking for inspiration in our curated watchlists.