DXY FORECASTBeen bullish for the past two week and on these week am looking for the price to head to the down side before we can push back to the upside.
USDX trade ideas

Post BTC Halving Price Prediction, DXY, $IBIT, and May ForecastAs I've been saying, we really just need a breather after the huge runup in Bitcoin and the altcoins pre-halving and with 7 consequetive up months and Green candles.
So it's no surprise April is selling off, and the halving was a 'sell the news' event. It's good news, because all markets need to rest and re-gain their strength to push higher.
Watch the video for details, but the TLDR is I think we'll drift sideways and even down to re-test the $60k region where we can see strong buy blocks until we get into May, and then we'll start to push higher and hopefully into bull-mania.
However, IF Bitcoin can get back above $66k - $68k on a daily closing basis, effectively washing out the Red block of sellers and back above both the 21 and 50 day EMA's (Exponential Moving Averages) then I would start buying BTC.

DXY 30 MINUTES CHART (analysis)Current position of DXY is at 105.700 the next target is expected to 105.600 it may reverse to 105.830 then our target is 105.500 to 105.300 to the main support level if it breaks first resistance level then it can fly more so stay focused on bullish
This analysis suggests potential trading opportunities based on current market dynamics and key price levels. Traders are advised to monitor these levels closely and adjust their strategies accordingly.

DXY Daily Trading Journal DXY Daily Trading Journal
Jan 2024 price changed market to a bull bias. Price weaved between premium and discount as it did seek higher prices.
April 12 price ran to the noted daily SIBI from Nov 2023 to rebalance April 12. Price continued to gravitated to the November 2023 GAP/SIBI this past week.
It seems likely for price to gravitate to the Monthly SIBI from Nov 2022 taking weeks buy stops for the weeks target.

DXY: Swing high BREAKOUT- You can see on the chart last week price was ranging sideways and closed with a weak bullish candle lefting behind an imbalance/FVG.
- We may predict price to retrace to 105.500 levels first to rebalance price delivery and then we could see a swing high breakout at 107.500 levels.

DXY IN MARCH 2024According to the news that will be published this week, I expect to see a downward trend in the dollar chart at the beginning of the week, and after that, the monthly dollar candle will be formed with the release of agricultural news.

DXY APRIL BIASWe are in the first week of April. This week, the unemployment rate will be announced and Pavel will give a speech about interest rate changes.
I suggest you use Wednesdays and Thursdays for trading.
I also drew the possible direction of the chart for you.

DXY pullback. The dollar traded in a tight range last week and with the US GDP and US PCE data prints scheduled for the week ahead we may see some selling pressure on the over-bought greenback.
I’m expecting a pullback towards the 61.8% Fibo level of 104.80 before the dollar bulls find continued momentum.

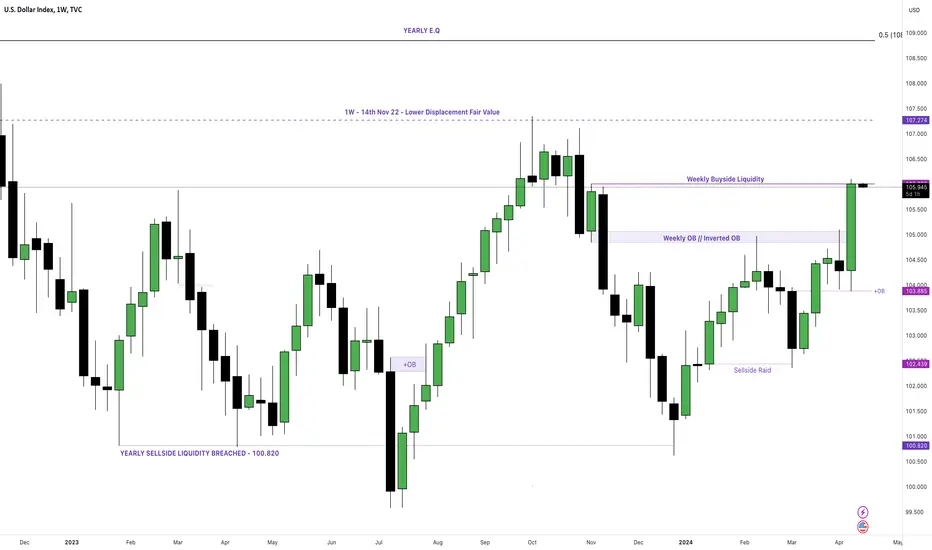
DXY - The Art Of Price Action The run upto weekly buyside @ 106.006 has been booked, as anticipated from last week. With my overall target of 106.006 met, i am expecting a minor retracement before a continuation up into the 14th Nov 22 lower displacement fair value gap.
This could take a few weeks to pan out. but i will be keeping this analysis updated throughout the week.
My philosophy is simple...
Fortify Michael J Huddlestone's concepts that I have studied to consistently predict where the market is more likely to go.
This includes;
- Market Structure
- Buyside/Sellside Liquidity
- Order Blocks
- Liquidity Voids
- Fair Value Gaps
- Optimal Trade Entry
- Premium/Discount Array
- SIBI/BISI
- Many More!
The strategies mentioned here are some of many that I use to implement into my analysis and over time, with consistency I aim to achieve a high degree of accuracy in the markets with the foresight and understanding to assess what went wrong when my bias is negated.
Credits;
- Michael Joe HUDDLESTONE
- Shawn Lee POWELL
- Toray KORTAN
DXY , D Tech Analysis, Three Candlestick Pattern , Breakout Approaching
***Not Meant For Trading Or Investing

DXY Weekly Analysis Here's the corrected version:
Last month, we anticipated that the #DXY price would continue to be bearish and take support liquidity from Mon 10 Jul '23. However, the fundamentals contradicted last month's analysis as the #DXY strengthened again after inflation rise and the Fed announced they would keep interest rates fixed until the next meeting. It's probable that we will see a Bullish trend in DXY this year if there's no decrease in inflation or interest rates.
This highlights the importance of fundamentals in this quarter. From a technical perspective, we observe weakness in breaking the support liquidity in #DXY, indicating that it will likely rise again and target Mon 02 Oct '23 for short-term liquidity.
For the long term, we anticipate the price will reach a fair value in the MON 07 Nov '22 liquidity gap as the long-term target.


DXY Price Analysis: 21 April 2024Monthly: In the monthly Price has been break the monthly BPR, so now the target it to go towards the M-BSL(107.354)
Monthly Bias: Bullish
Daily: The price has been brake the M-BPR, with a clear bulish D-MSS, along with D-FVG, so the momentum of the price is bulish, now the price has been taken the D-FVG+ so we will anticipate the price will go upward to wards the Daily-BSL nested in the D-VI.
Daily Bias: Bullish

DXY CHART VIEW
Hello Traders, here is the full analysis for this pair,
let me know in the comment section below if you have any questions,
the entry will be taken only if all rules of the strategies will be
satisfied. I suggest you keep this pair on your watch list and see if
the rules of your strategy are satisfied.
Dear Traders,
If you like this idea, do not forget to support it with a like and follow.

DXY, Elliott wave analysis■Outlook for DXY on 1W chart.
We are in sub-wave iii of the upper degree wave C.
The sub-waves of wave iii will form a 5-wave impulse.
If the assumptions of this scenario are correct,
the sub-wave (3) of wave iii should start soon.

USD still going strongHello fellow traders , my regular and new friends!
Welcome and thanks for dropping by my post.
USD is consolidating (since last week) for a breakout..more on the bias to the upside.
Do check out my recorded video (in trading ideas) for the week to have more explanation in place.
Do Like and Boost if you have learnt something and enjoyed the content, thank you!
-- Get the right tools and an experienced Guide, you WILL navigate your way out of this "Dangerous Jungle"! --

DXY (DOLLAR INDEX) Shorts from 107.000My view on the dollar is relevant to all major pairs I trade, including GOLD, GBPUSD (GU), and EURUSD (EU). This week, we are approaching a strong high point with a previous Wyckoff distribution on a higher timeframe, now entering a significant supply level on the 9-hour chart. I anticipate a reaction at this level followed by a temporary decline in the dollar.
I expect the dollar to drop at least to the newly established 12-hour demand zone, where I foresee a bullish continuation. This supports the broader bullish trajectory of the dollar, aiming towards tapping into a 2-month supply zone where a major bearish reaction is expected.
Therefore, if I anticipate the dollar to initially rise and then drop, I also expect EURUSD and GBPUSD to continue their downward trends accordingly.
Note that this is my current bias, and I will adjust it based on evolving market trends. It's essential to consider various zones and scenarios for a comprehensive analysis."
This version maintains your original message while improving clarity and readability. Feel free to adjust it further based on your preferences!

New Week OutlookAn annotated graph of my weekly outlook for the DXY. Forex pairs (EUR/USD) (GBP/USD) are due to inversely correlate.
NFA

$DXY - Next Resistances to Watch *W & *D (tf) TVC:DXY *D (tf)
Previous Ideas of Resistance to Watch (before & after 'play button' )
(before & after 'play button' )
Next decent Resistances for TVC:DXY to face will be the 0.5 Macro Fibb Level @107.7 level .
Surpassing that via decent breakout, correction may be anticipated as a retest and
confirmation for TVC:DXY to continue Higher.
Meanwhile on the *W (tf),
TVC:DXY managed not to close its 12 Consecutive Green Weekly Candlestick.
Whats worrying is that the last Weekly Close was very Bearish in Price Action,
printing whats called ' A Topping Tail '


Dollar Index (DXY): Potential Scenarios Explained 💵
That was quite a boring week for Dollar Index.
The market was stuck within a narrow horizontal range on a daily.
Next week, wait for a breakout of the range.
Bullish breakout of its resistance will be a strong trend following signal,
while a bearish violation of its support will initiate a correctional
movement on the market.
Next key resistance - 106.85
Next key support - 105.20
❤️Please, support my work with like, thank you!❤️

📊 U.S. Dollar Index Headed Towards 105/106The market moves in waves, pretty simple.
➖ Up and down.
From July through October 2023 we had a major bullish wave followed by a distribution phase.
From November through late December 2023 we had a correction.
➖ Up and down...
We are now set to see a bullish wave based on how the market cycles through positive and negative, red and green, bearish and bullish.
My target is set at around 106...
As the DXY moves up, Stocks, Crypto and the rest will crash; It is inevitable... Like a wave in the ocean, it goes up and down and finally permanently gone.
Namaste.

Possible Trend of the Dollar Index in 2023In this idea, the trend of the dollar index in 2023 is shown.
In 2022, due to the fall of the stock index of most industrialized countries, we saw the growth of the dollar index, and the final resistance line according to the Fibonacci tool set at the Fibonacci level of 1.41 and the index at 114.
but after that, the dollar index began to fall, and this fall has three hard resistance levels ahead, and the hardest level is the range between Fibonacci 0.38-0.5.
Good luck.
SEYED
