ETH 2024 cycle high potential targetsA break of the ETH all time high could put any of these FIB extension targets in play.
If we break the all time high by June 1st, I could see the FIB 1.618 extension of 7,310 being hit by early fall 2024 or by year end.
ETHUSD trade ideas

Bullish on ETH for a New pump to $5.000#ETH had a strong price increase in Q1 2024, prices have now completed a correction and are ready to return to gain higher. The new opportunity at the current price
🟢 This is a sign calling for a continous upside to pass $5.000
Current ETH: 2980 🚀

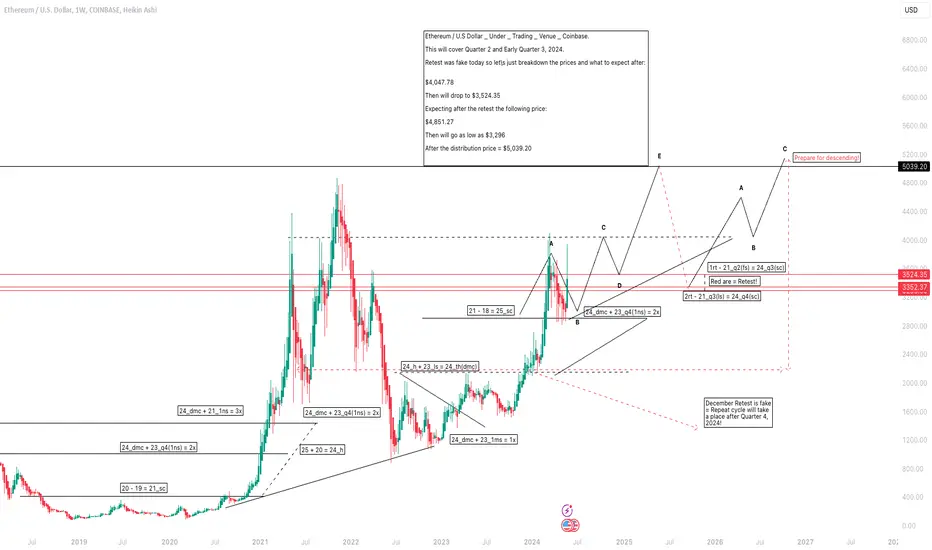
Ethereum / U.S Dollar _ Under _ Trading _ Venue _ Coinbase.Ethereum / U.S Dollar _ Under _ Trading _ Venue _ Coinbase.
You're unsure when and why and how far can go and where will be the lowest and the highest!
I will break it down as they follow numbers so there will be no if and when!
This will cover Quarter 2 and Early Quarter 3, 2024.
Retest was fake today so let\s just breakdown the prices and what to expect after:
$4,047.78
Then will drop to $3,524.35
Expecting after the retest the following price:
$4,851.27
Then will go as low as $3,296
After the distribution price = $5,039.20
Delayed ETF News and its Impact.The recent delay in approving a spot Ethereum ETF by the SEC has dampened some of the bullish sentiment surrounding ETH. This news contributed to the correction from higher levels, alongside a broader crypto market pullback.
Falling Channel/Wedge and the $4400 Target:
The current chart pattern for ETH/USD does resemble a falling channel or wedge. This pattern often precedes a breakout, potentially towards the upper resistance level around $4400. However, it's crucial to consider:
ETF Delay as a Hurdle: The lack of an immediate ETF approval reduces the short-term excitement that could have fueled a rapid breakout.
Technical Indicators: Other technical indicators alongside the chart pattern should be considered for confirmation of a bullish breakout.
Factors to Consider for a Potential Breakout:
Renewed ETF Optimism: While the ETF approval seems unlikely in the immediate future, any positive developments or renewed optimism surrounding the ETF could reignite bullish momentum.
Overall Market Sentiment: The broader cryptocurrency market sentiment significantly impacts ETH's price. If the general market experiences a strong upswing, ETH could potentially break out of the falling channel/wedge.
Technical Analysis: Utilizing additional technical indicators like moving averages, relative strength index (RSI), and volume analysis can strengthen the case for a potential breakout.
Important Caveats:
Delays Don't Guarantee Denials: While the ETF approval seems less likely in the short term, it doesn't guarantee a complete rejection. Long-term approval is still a possibility.
Technical Patterns Aren't Guarantees: Even though the falling channel/wedge suggests a potential breakout, technical patterns shouldn't be interpreted as absolute predictions.
Conclusion:
The delayed ETF news has undoubtedly impacted ETH's price, but a breakout towards $4400 remains a possibility. However, it's crucial to acknowledge the influence of broader market sentiment, technical indicator confirmation, and the uncertain timeline surrounding the ETF approval.

Ethereum: Ready or Not? ⌛In the Ethereum Chart, our alternative scenario, which will be activated on a break above $4091, now carries a high probability of 42%. However, as long as the price remains below this level, we must continue to expect a descent into our green Target Zone (between $2807 and $1813) first.

fading eth to 12K? NGMIChart speaks for its self...eth is headed to 12k and there is absolutely nothing your fav soylana infuenza or laser eye maxi can do to stop it.
Cope and seethe beras...

Ethereum 15k+- i am far to be Elliot Wave expert and to be honest i am not a fan.
- there's a lack of precision and EW can be extended.
- Don't forget that the real name is " Elliot Wave THEORY ".
- included a Fibo Analysis + Trend Analysis + famous bubbles.
"The Elliott Wave Theory is a form of technical analysis that looks for recurrent long-term price patterns related to persistent changes in investor sentiment and psychology. The theory identifies impulse waves that set up a pattern and corrective waves that oppose the larger trend ".
- Everything is in graphic as always.
Happy Trading !

Ethereum breaking higher now Intraday Update: Ethereum has broken higher after a multi day consolidation under the 78% retracement. The break higher should put the **% retracement in view at 3964.

Ethereum 1d by RB🧐
Hello, dear friends! Today, let's take a look at the Ethereum/Dollar chart!💥
On February 25th, the last line of the descending trend was broken upwards, as indicated by the blue circle - that's serves as an excellent signal for further growth.
The question now is when to expect a correction? And how deep will it be?🧐
The next strong resistance levels are 3590 - 3980! Reaching these levels, the price may start a correction for further growth. The depth of the correction will depend on further price formations, so I will update the chart accordingly!
Thanks for Your attention.
Stay tuned!🫶
Sincerely Yours, Kateryna💙💛

ETH Analysis, Chart is speaking itself !!!Hi.
COINEX:ETHUSDT
Ethereum finally managed to break the megaphone, which means we should expect more price increases from Ethereum.
Traders, if you liked this idea or have your opinion on it, write in the comments, We will be glad.
_ _ _ _ _ _ _ _ _ _ _ _ _ _ _ _ _ _ _ _ _ _ _ _ _ _ _ _ _ _ _ _ _
✅Thank you, and for more ideas, hit ❤️Like❤️ and 🌟Follow🌟!
⚠️Things can change...
The markets are always changing and even with all these signals, the market changes tend to be strong and fast!!

ETH - Intraday Long Idea @3672ETH pulling back after the big rally in 3 waves into resistance. Trying to catch wave 4 in the smaller degree
Open @ 3672
T1 @ 3744
T2 @ 3942
SL @ 3567
Risk 1%
NFA

All-Time Highs in the Crosshairs for ETH/USDETH/USD bulls have made a strong comeback in recent days. Following Monday’s +13.0% advance and Tuesday’s +7.0% push, the major altcoin is within reach of challenging all-time highs of $4,092. Following the break of key resistance at $3,677 (now serving as support) and April’s high of $3,726, the path of least resistance is towards all-time highs.
You will note that price action formed an indecision candle on the retest of $3.677 as support, with buyers seemingly in command as of writing.

$ETH Price Prediction 5/22/2024Price continues to hold between pattern resistance and 3810 forming into a symmetric layout.
Early breakout seems very possible but wait to flip 3810 before assuming further recovery.
Keep in mind that we're in a MACD convergence phase.
www.tradingview.com

The market is extremely divergentBTC pulled back as expected, compared to the very strong support for ETH's price, with ETH's current weekly weighted IV still exceeding 100%, while BTC's current weekly IV is only 50%.
The primary reason for this rare phenomenon is of course the uncertainty of the approval of the ETH ETFs. In the last two days there have been so many of these mega short-term spreads and calendar spreads that shows the market is extremely divergent. Judging by the structure of the market's positions and the current IV structure, the current level of divergence has already exceeded that during the period of the ETH to Pos.
So it is the man made policies that are the biggest uncertainty, Long Crypto!

FREMA Levels for StrategyFREMA facts:
Upper hot color bands are based on Buying Pressure
Lower cold color bands are based on Selling Pressure
This makes the levels of bands be more relevant to the candle metrics. The regular ATR bands the upper and lower levels expand equally with ATR change. Whereas FREMA levels expand and shrink by the change of 2 factors: Buying and Selling Pressure.
In a nutshell, it's the bullish and bearish parts of the candle measured with separate variables that govern the upper and lower bands independently. Therefore we can agree that out of all volatility bands, the FREMA is more native to the nature of ongoing price fluctuations.
The volatility levels can be implemented in strategy for trading the range of probabilistic prices. Combination with trend-following indicators can determine the condition of multiple buying orders at different cold color levels.
To be able to catch the very bottoms, the condition of bullish entry series should be set with 0 open trades unless the price or any other price-following substituting components are equal or lower than one of the lowest bands . This filters the entries from risks of buying as soon as price falls below middle deviation line.
For filtering with "Buying and Selling Pressure" use open source code below:

The last bullish chance of Ethereum in Mid term!Hi.
BINANCE:ETHUSDT
Today, I want to analyze ETH for you in a 1D time frame so that we can have a MID-term view of ETH regarding the technical analysis. (Please ✌️respectfully✌️share if you have a different opinion from me or other analysts).
➡️ETH has done a Impressive Movement recently but the odds of another bullish Movement is Pretty high because the pattern which ETH is in, Is a Bullish Flag Pattern! Since The break out has not happened, there is no confirmation of a Bullish Movement But If It happens, we Can Expect a Bullish Movement as much as the Measured Price movement (flag pole) to happen!
✅ Due to the Ascending structure of the chart...
🟢 ETH has been Bullish Recently!
🟢REEGULAR BULLISH Divergence
🟢ETH is in a Bullish Flag
🟢(AB=CD)
🟢Price is gonna Reach $4100
✨Targets are:
🎯$3390
🎯$0.3500
🎯$0.62
🎯$0.3750
🎯$0.4100
Stay awesome my friends.
_ _ _ _ _ _ _ _ _ _ _ _ _ _ _ _ _ _ _ _ _ _ _ _ _ _ _ _ _ _ _ _ _
✅Thank you, and for more ideas, hit ❤️Like❤️ and 🌟Follow🌟!
⚠️Things can change...
The markets are always changing and even with all these signals, the market changes tend to be strong and fast!!

ETHUSD bullish movement is about to happen!!!Hi.
BINANCE:ETHUSDT
Today, I want to analyze ETH for you in a 12H time frame so that we can have a MID-term view of ETH regarding the technical analysis. (Please ✌️respectfully✌️share if you have a different opinion from me or other analysts).
➡️ETH has done a Impressive Movement recently but the odds of another bullish Movement is Pretty high because the pattern which ETH is in, Is a Bullish Flag Pattern! Since The break out has not happened, there is no confirmation of a Bullish Movement But If It happens, we Can Expect a Bullish Movement as much as the Measured Price movement (flag pole) to happen!
✅ Due to the Ascending structure of the chart...
🟢 ETH has been Bullish Recently!
🟢REEGULAR BULLISH Divergence
🟢ETH is in a Bullish Flag
🟢(AB=CD)
🟢Price is gonna Reach $4100
✨Targets are:
🎯$3390
🎯$3500
🎯$3750
🎯$4100
Stay awesome my friends.
_ _ _ _ _ _ _ _ _ _ _ _ _ _ _ _ _ _ _ _ _ _ _ _ _ _ _ _ _ _ _ _ _
✅Thank you, and for more ideas, hit ❤️Like❤️ and 🌟Follow🌟!
⚠️Things can change...
The markets are always changing and even with all these signals, the market changes tend to be strong and fast!!

Bull flag for eth cool off. 4k and then a massive cup and handleBull flag for eth cool off. 4k and then a massive cup and handle
ETF is looking like it may be approved tomorrow
From the Article
Amid increasing speculation about the possible approval of a spot Ether exchange-traded fund (ETF) in the United States on May 23, global investment manager VanEck’s ETF has been listed by the Depository Trust and Clearing Corporation (DTCC) under the ticker symbol “ETHV.”
The DTCC is an American financial market infrastructure provider that offers clearing, settlement and transaction reporting services to financial market players. A listing on DTCC is considered a crucial step before final approval from the U.S. Securities and Exchange Commission (SEC).
cointelegraph.com

ETH consolidating before continuing its way to $4KEther extended its gains over the past 24 hours as investors now expect an approval of Van Eck’s application for a spot Ether exchange traded fund (ETF) as early as today or by tomorrow at the latest. This would be the first of nine similar applications to be approved by the Securities and Exchange Commission (SEC).
“ If they approve the Ethereum ETF, they are approving the entire industry. This is the last dam to be broken,” the crypto profile Anthony Pompliano said.
The price of Ether rose another 3 percent on these speculations over the past 24 hours. It has risen by 29 percent over the past seven days.
“If the spot ETH ETF is approved, it will be a true shock to everyone I know in DC who's close to this process. That doesn't mean it won't happen. It means approval could signal a major shift in US crypto policy after the SAB 121 vote, perhaps more important than the ETF itself,” the Chief Legal Officer of Variant Fund, Jake Chervinsky echoed.
The US Congress has turned down the SEC’s proposed SAB 121 regulation, which would have forced crypto custodians to record their clients’ crypto holdings as liabilities on their balance sheet. The concerned financial institutions would incur massive capital expenses if this regulation was enforced. The question now is whether President Joe Biden will veto the decisions of the two chambers as he has indicated he will do, or not.
Enjoying our newsletter? Get access to Lykke's comprehensive range of products and services. Get Lyffe now!
Inflows into the ETH ETFs estimated to reach up to $45 billion
Inflows into the above-mentioned Ether ETFs will reach between $15 and $45 billion by next summer, conditional on their approvals, according to the estimates of the Head of Forex and Digital Assets research at Standard Chartered Bank, Geoff Kendrick. He forecasts that the price of Ether will reach $8,000 by year-end, the Block reports.
Clouds with some sun are gathering over Ethereum in the next 24 hours, but bullish sunny vibes will be back within 3 days and extend to the one-week time horizon. This indicates further upside potential for ETH.
Follow us for more crypto news and weather reports!

ETHEREUM, 1 day ahead of ETF Since Monday, ETH has risen by a spectacular 25%!
On Tuesday, we recovered a key zone: the $3730 level, where a great deal of liquidity was present.
We are now 1 day away from the potential approval of the Ethereum ETF (May 23, 2024).
It is therefore very difficult, if not impossible, to position oneself on the market, even if the direction seems to be taking shape.
So I'm going to remain a spectator on ETH while waiting for the results.
If the ETF is approved, I expect a correction over the next few days.
“Buy the rumour, sell the news”.
Feel free to subscribe and boost this post if you enjoyed my analysis, and tell me what you think!
Happy trading and a great week :)

3835 retestEthusd has found support currently and will retest close to area of 3840 where resistance was met. 3835 retest is now in progress.

ETH Respects The Trend, But For How Long?This is my first slightly longer post about the crypto market in some time. Despite being an ETH post, I get more into the market as a whole in this post. Here, I will do a little analysis on the above ETH chart, but primarily I will speak about fundamentals, my accuracies and my inaccuracies, and why I continue to observe the market.
Ethereum was my biggest winner in the previous bull market. After buying between $100-200 in 2018-2019, I sold near $3000 at the end of 2021. Since then, I didn't "buy the dip" or return to investing in the cryptocurrency market. Sure, my opinion on things has limited my ability to see the "forest through the trees," so to speak. So far, I've missed out on at least tripling my money again on ETH, when I could have bought close to $1000 if I had been bullish on it long term.
Despite the ETF approval for Bitcoin, and despite a looming ETF approval for Ethereum, I am longer term bearish on these assets. This is due to a simple question, the answer to which has not changed: If Bitcoin and other cryptocurrencies ceased to exist, would the world be impacted significantly?
With the introduction of these ETF's, the answer to this question may change from "not at all" to "a little bit," but even then, the people who would be impacted are asset holders and managers who are generally making small bets on crypto. The bigger concern is that some brazen investors will follow Michael Saylor's suit and create unnecessary risk by buying assets that have very few real-world application. If this snowballs into an even bigger bubble, I do worry about the impact on the broader financial system.
As for crypto's effect on the economy: Money goes into crypto and it stays there. All those billions that have been invested in Bitcoin ETF's could go somewhere else and have a positive ripple effect on the economy and people's lives. Instead, it's stagnant money, and it only has value because people continue to buy it. The primary reason why I'm longer term bearish on these assets is because I believe eventually demand will be unable to keep up, and prices will stagnate, ultimately fading into a much longer bear market. This is particularly the case when broader markets fall into a more deflationary period, which I think will happen eventually (though as we know, this is very hard to predict).
It is clear that I was wrong in speculating Bitcoin would not make a new all time high. It did, but I wonder how long it could really sustain a SIGNIFICANT higher high. I'm not talking about $70-75k. I'm talking about $100k+ prices.
Back in 2022, I speculated that ETH would drop to the green zone in my chart. It came very close, but bottomed out between $800-1000, a major level from the 2017-2018 bull market. I did successfully anticipate much lower prices for Bitcoin and Ethereum than most were expecting at that time. I did not anticipate such an extended move up from those bottoms.
It is important to note that in multiples, crypto is outpacing the stock market from bottom to recent top. However, stocks are making more significant new all time highs while crypto is not. Even Gold is booming, breaking significant highs. This is something I did anticipate a while ago. There is no indication that holding crypto ETF's will be better than holding stocks. But hey look, Microstrategy (MSTR) is almost at dotcom bubble peak levels.
Back to ETH - if one is to take a big short position, it seems unwise to do so until the long term trendline is clearly broken. Here is the trendline zoomed in. You can see that price even broke down briefly, though continued to hug it for the most part while the decline did not accelerate further.
For now, it continues to ride. There could easily be more spikes up, as mania begins to take hold. But I sincerely also wonder how much extra money retail has to drive prices up this time around. Data shows that spending has slowed down, while people have mostly burned through their pandemic savings. Where will the liquidity come from? Is this rally even being driven by enough liquidity to sustain these prices? There is also always money to be made on the short side. Let's not forget that a short ETH ETF already exists.
We will eventually find out the answers to these questions. These are the primary reasons I continue to observe markets. I want to know more deeply what's going on. What are the broader cultural and economic shifts that occur under the surface, which cause major impacts on society as a whole? These mysteries keep me coming back.
Crypto is still interesting to me in this respect because it has such a psychological impact on the investor. I know directly from experience. It promises big things and then barely delivers. Or, it will appear to be completely dead and then cause eyeballs to pop when it suddenly triples in value. Profiting from it in the last cycle required putting up with a long emotional rollercoaster. Is there a light at the end of the tunnel for the crypto investor? Is this, right now, the light at the end of the tunnel? If so, this is a pretty far cry from the original intentions of Bitcoin. It's all gone right back into the pockets of traditional financial institutions. And perhaps, it is this discrepancy that makes me think it's really a sheep in wolf's clothing, in effect something perfectly boring and ordinary disguised as something disruptive. It is possible that it it may have not turned out this way, but due to human collective decision-making, greed, and exploitation, here we are.
Despite my more sporadic posts, I continue to observe and analyze. It is not necessarily about being right or wrong for me. Maybe when I was younger it was, but now it's more about the process. It is important to let go of the attachment to being right.
Thank you for reading as always. And of course, this is meant for speculation and entertainment only, not financial advice.

ETHEREUM Will an ETF approval cause a massive rally?Exactly a month ago (April 22, see chart below), we called for Ethereum's (ETHUSD) bottom and gave a medium-term buy signal:
With the SEC facing deadlines on May 23 and May 24 to decide on spot Ethereum ETF applications by Vaneck and Ark Invest, we might be in front of a massive rally. Even from a technical point of view, the historic Cycle performance of Ethereum suggests that currently we might be getting off a similar consolidation to August - October 2020.
Observe how the 1W RSI is making a bullish reversal after having pulled-back from a marginal Channel Up break-out. At the same time, the 1W LMACD is about to make the exact same Bullish Cross it did on the week of November 09 2020, when again it started to break above that consolidation.
What followed these events back then was a massive rally that peaked marginally above the 1.5 Fibonacci extension level. As a result, we remain bullish long-term, expecting a strong rise until the end of the year, targeting $12000 (Fibonacci 1.5 ext).
-------------------------------------------------------------------------------
** Please LIKE 👍, FOLLOW ✅, SHARE 🙌 and COMMENT ✍ if you enjoy this idea! Also share your ideas and charts in the comments section below! This is best way to keep it relevant, support us, keep the content here free and allow the idea to reach as many people as possible. **
-------------------------------------------------------------------------------
💸💸💸💸💸💸
👇 👇 👇 👇 👇 👇
