EURPLN trade ideas

EUR/PLN makes a correction but possible reversal around supportThe EUR/PLN is moving around the support zone between 4.25 - 4.28. Please be aware that around this level the EUR/PLN can make a higher low.
If this happens, then a positive short term trend can start and that will give room for more upside potential for a test the high of this year!
So lets watch closely to what will happen around this level.


EURPLN is technically on a new up trendLONG - EURPLN
SL: 4.24797 (Suggested by our algorithmic system)
TP: 4.31189
Reasons behind this idea:
1. Price broke through resistance trendline
2. RSI & MACD indicator is showing bullish divergence
Caution: Important economic reports are due on November 15th.
---------- Chart Drawings ----------
Red Dotted Line: Broken Resistance Trendline
Blue Solid Line: Support Trendline
Purple Vertical Line: Suggested Stoploss by our algorithmic systems (under testing)
Green Vertical Line: Suggested Take Profit
Green Arrow: Bullish Divergence
Trade idea from our mobile app: ibb.co
Please trade responsibly and good luck!


ANALYSIS ON EURPLNANALYSIS ON EURPLN
Welcome to my analysis
-
30Min CHart
-
Interesting Point of interest In the EURPLN pair.
- Price above 100/200 day EMA.
- sell at top 4.29000 zone.
- Expecting more downward momentum.
- Watch 4.2500-4.21600 for take profit.
- MACD showing bearish divergence
Stay Tuned

Long EURPLN @ 42600 - RSI Divergence #fxRSI Divergence on EURPLN. Combining Friday & Mondays price action gives us a solid bullish hammer as an entry. Stop placed below recent low and limit placed at 50% retracement of recent move for 1:4.3 R:R. One slight drawback on this setup that isn't sitting right with me is the fact that the lower bollinger band has not been tested although the RSI dipping to 25 shows its oversold status.


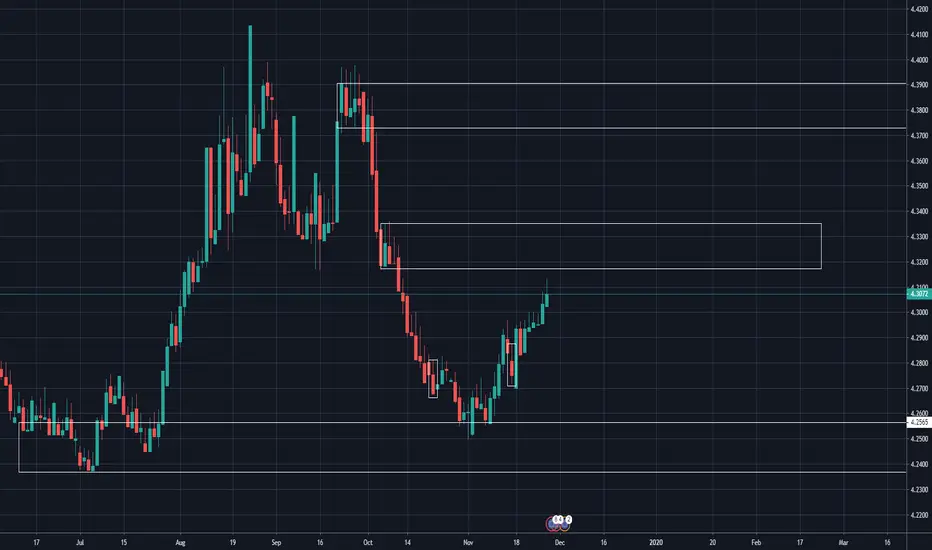
EURPLN: Short opportunity within a 1D Rectangle.The pair has discontinued its uptrend (RSI = 61.957, MACD = 0.014, Highs/Lows = 0.0151) this week having been rejected near the 4.4000 1D Resistance. This creates ideal conditions for a reversal towards the 4.31460 1D Support, essentially aiming to trade within a Rectangle pattern. We are short on this formation with 4.33200 - 4.31460 as the Target Zone.
** If you like our free content follow our profile (www.tradingview.com) to get more daily ideas. **
Comments and likes are greatly appreciated.

EURPLN shortTrading these odd pairings can be tough but with the ECB set to destroy the value of the Euro further in about a week and the algo triggering a short signal, might be worth a small play.
Volume is starting to pick up, and momentum to the downside has plenty of room to run even if it's flattening out a bit today.


EURPLN just look at that wick. Reverse guranteed
Why to
* Nice reversal candle in 1D
* NO surprise that EUR is in almost recession.
* No surprise that East Europe and Poland is doing well
* Many technical indicators showing good opportunity.
* Very good R:R
Why not
* Politically Poland isnt the best friend with Europe union
* Same as always - Trade wars


EURPLNThose who took we were just short of the TP but a manual close was done before the pullback - s3.tradingview.com
Waiting to see what happens next watching the HIGH and LOW area label on the charts

EURPLNPerforming good keeping an eye on the highs will be looking for a break higher and TP being hit

EURPLN short 4HEntry - technical algo short signal
TP1 50% - 1ATR
TP2 25% - 1st RVGI cross
TP3 25% - 2nd RVGI cross
SL 1.5 ATR - trail after TP1


The market is thin, let's analyze the Polish Zloty!Today is a holiday in the United States – July 4th Independence Day and considering this the market is thin and calm.
We will analyze EUR/PLN
1DTF shows us a lot of consolidation, basically since about July of last year. We can observe a local dip down for the pair that started on May 22nd and this downtrend price reached May 2018 lows on July 1st.
Switching to the 4H TF shows me the following:
On July 1st I see a bullish engulfing, at which time Williams %R left the oversold zone. The following day, Jul 2nd, MACD lines intersected, a local correction to the upside followed on the 3rd and this morning we see an inverted hammer and bullish engulfing followed by the bulls breaking the 9EMA and local trend line to the upside.
A s a result : At this time Long positions look favorable, ideally after the break of 23.6 Fibo level – which is where the price is currently travelling, with target areas of 4.24830 (38.2Fibo) followed by 4.25170 (50% Fibo) .

