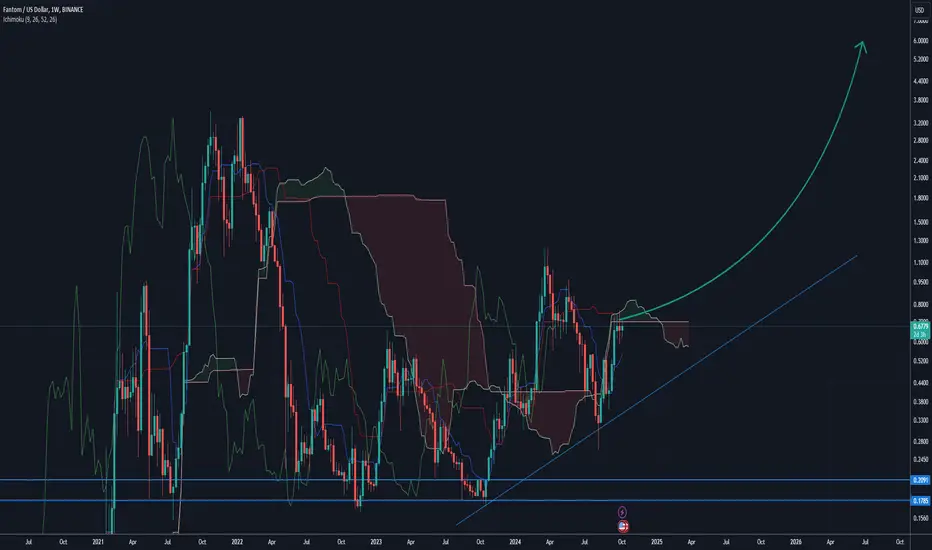
FTMUSD Trade setupAccumulate in this area, FTM is primed in Q4 2024 - Q1 2025. Sonic will generate new ATH's.
Key stats
About Fantom
Launched in 2019, Fantom is a smart-contract compatible network, built with a focus on providing the infrastructure needed for DeFi. It aims to address the ‘blockchain trilemma’ through the use of its ‘Lachesis’ consensus mechanism which (in theory) allows the network to be decentralized, secure and scalable — all at the same time. Its native token FTM is used for staking, paying fees, and governance of the ecosystem and as a layer 1 network, it has positioned itself as a competitor to Ethereum. Although it still has a long way to go before it can take on the king of DeFi.

#FTM FANTOM COIN LONG POSSIBILITY - ALTCOINI will be watching to marked 'Long Zone' for possible long position.
LTF confirmation will be needed in order to open position.
Possible target would be the purple line.
Risk assests are doing good recently but we have still geopolitical risks currently.
Nothing i share is financial advice. Educ

FTM LongFTM is currently testing resistance at $0.71 as it enters a price discovery phase. The chart forms an early-stage symmetrical triangle pattern accompanied by positive momentum indicators. This pattern suggests a period of consolidation, where the price is likely to move sideways within a narrowing r

FTM LONG Bears failed to drop the price below 0.6 .
0.58 - 0.55 demand zone acting as strong support. Coincides with golden zone for current wave retracement between 0.5 and 0.618 fibs.
Bulls fully in control from here. Next target for long TP : 1.02.

FTM Short : Bulls ExhaustedLooks like bulls are exhausted from recent up trend. 1.618 fib point should have been the take profit for most long traders. Price broke below demand zone at 0.618 indicating increasing sell pressure. Same demand zone is now acting as supply zone (resistance that bulls have failed to break above.

Head and Shoulders with price retestA drastic dip occurred with week buy action. FTM value has been reset to the low 0.60 zone. I expect a price bounce from the head and shoulder retract. I called a head and shoulder earlier this week on the XRP chart, and FTM has also followed that trend. 20MA and 200MA are still playing the break fo

FTM update pushing momentumFTM is hitting the momentum Fib, the ever important signal of strength and momentum in my opinion. My late November target still remains pictured as the circle. There is moderate resistance around the next Fib but a wide range after that. The weekly stochastic might need a bit of a reset but the dai

Symmetrical TriangleFTM is breaking resistance for the third time. A possible Symmetrical triangle has formed to continue the upward trend. 200 MA is still playing the break. Value should play above resistance in the coming days, fighting for higher highs and new lows.

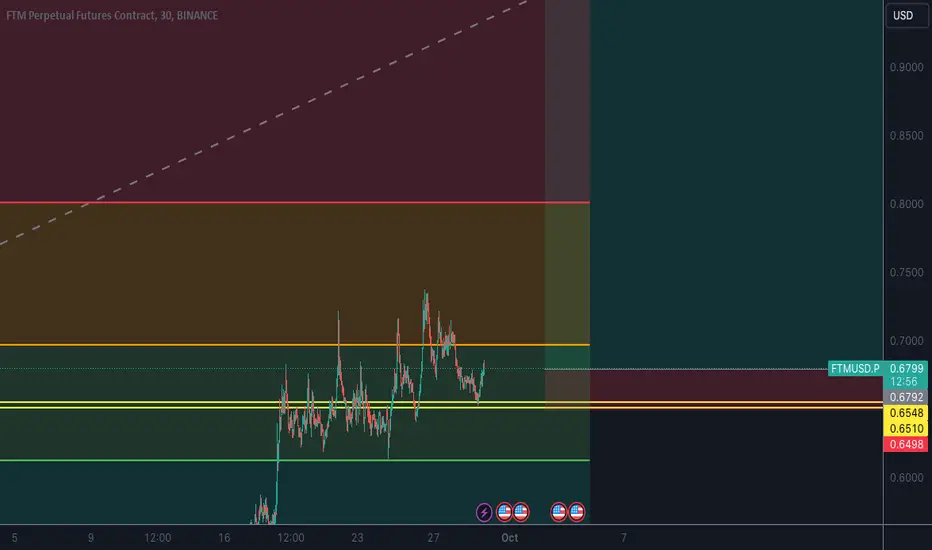
FTM Uptrend ContinuationPrice retraced and found strong support at demand zone around 0.65.
We can take another long position from here with SL slightly below low of the demand zone. TP should be around 1 USD.
See all ideas
Displays a symbol's price movements over previous years to identify recurring trends.
Curated watchlists where FTMUSD is featured.

DeFi Tokens: Finance 2.0
24 No. of Symbols

Gen 3 crypto: A new day dawns…
25 No. of Symbols

Smart contracts: Make the smart decision
36 No. of Symbols
See all sparks
Frequently Asked Questions
The current price of Fantom (FTM) is 0.6439 USD — it has risen 2.64% in the past 24 hours. Try placing this info into the context by checking out what coins are also gaining and losing at the moment and seeing FTM price chart.
The current market capitalization of Fantom (FTM) is 1.81 B USD. To see this number in a context check out our list of crypto coins ranked by their market caps or see crypto market cap charts.
Fantom (FTM) trading volume in 24 hours is 203.74 M USD. See how often other coins are traded in this list.
Fantom price has fallen by −12.96% over the last week, its month performance shows a −2.40% decrease, and as for the last year, Fantom has increased by 182.04%. See more dynamics on FTM price chart.
Keep track of coins' changes with our Crypto Coins Heatmap.
Keep track of coins' changes with our Crypto Coins Heatmap.
Fantom (FTM) reached its highest price on Oct 28, 2021 — it amounted to 3.6894 USD. Find more insights on the FTM price chart.
See the list of crypto gainers and choose what best fits your strategy.
See the list of crypto gainers and choose what best fits your strategy.
Fantom (FTM) reached the lowest price of 0.0017 USD on Mar 13, 2020. View more Fantom dynamics on the price chart.
See the list of crypto losers to find unexpected opportunities.
See the list of crypto losers to find unexpected opportunities.
The current circulating supply of Fantom (FTM) is 3.17 B USD. To get a wider picture you can check out our list of coins with the highest circulating supply, as well as the ones with the lowest number of tokens in circulation.
The safest choice when buying FTM is to go to a well-known crypto exchange. Some of the popular names are Binance, Coinbase, Kraken. But you'll have to find a reliable broker and create an account first. You can trade FTM right from TradingView charts — just choose a broker and connect to your account.
Crypto markets are famous for their volatility, so one should study all the available stats before adding crypto assets to their portfolio. Very often it's technical analysis that comes in handy. We prepared technical ratings for Fantom (FTM): today its technical analysis shows the neutral signal, and according to the 1 week rating FTM shows the buy signal. And you'd better dig deeper and study 1 month rating too — it's buy. Find inspiration in Fantom trading ideas and keep track of what's moving crypto markets with our crypto news feed.
Fantom (FTM) is just as reliable as any other crypto asset — this corner of the world market is highly volatile. Today, for instance, Fantom is estimated as 1.59% volatile. The only thing it means is that you must prepare and examine all available information before making a decision. And if you're not sure about Fantom, you can find more inspiration in our curated watchlists.
You can discuss Fantom (FTM) with other users in our public chats, Minds or in the comments to Ideas.