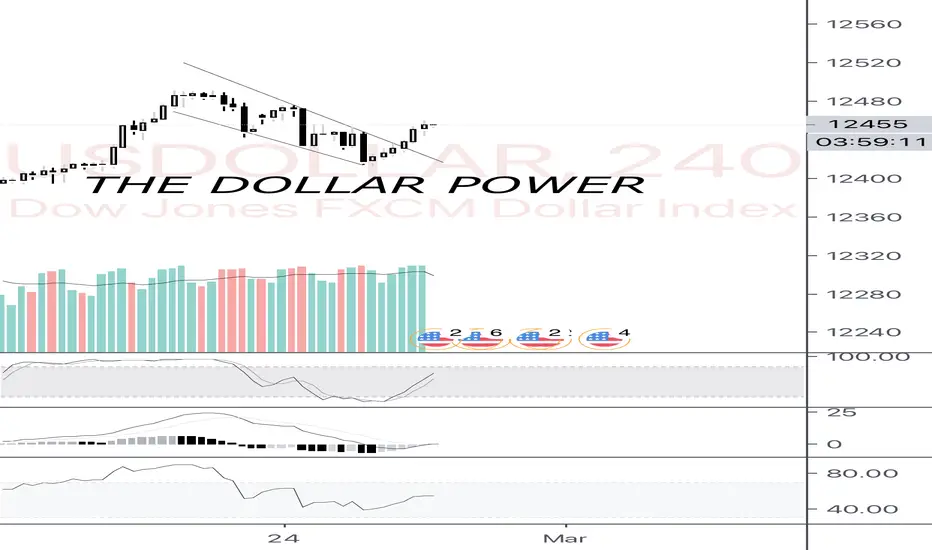
2/28/20 Analisis del USDOLLAREl indice del dollar se encuentra en maximos, pero presenta evidencia de escases de compradores
USDOLLAR trade ideas

USDOLLAR Momentum Down As Yields DeclineThe momentum of the USDOLLAR has declined over the course of the week. We can see this by the convergence of the green 5-day EMA towards the orange 10 day EMA (green ellipse). Moreover, the RSI has moved closer to 50 (red rectangle). As markets capitulated this week we note the bottom chart of the US 2-Yr note i.e. the yield has dropped markedly (blue rectangle). This reflects a renewed expectation by the market that the Fed will be forced to cut rates in 2020 more aggressively than initially forecast. Cuts are now expected in April, June and December. However, the greenback is showing some resilience. Today's candle (still to complete) looks like a bullish hammer (green arrow). As such we continue to monitor and if the green 5-day EMA crosses below the orange 10-day EMA and the RSI drops below 50, these will be considered as bearish developments.

Nothing to fear but fear itselfYou have nothing to fear the U.S. mint is here
Just buy these stock dips code name Tesla
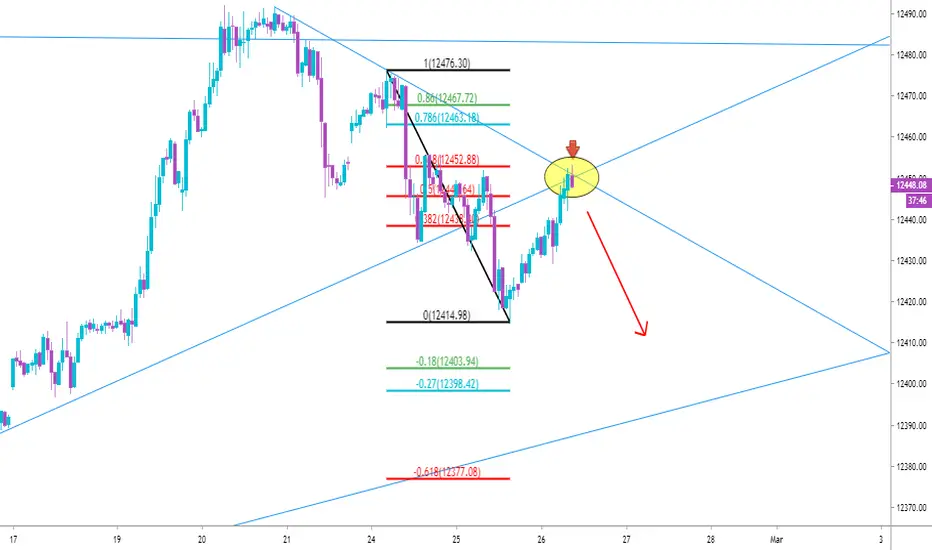
USDOLLAR(H1 chart)...Sell opportunity at the confluence zoneLook to sell with PA signal confirm towards UTL
USDOLLAR Bullish Flag Continuation on H1; Awaiting BreakoutThe USDOLLAR's green 5-hour EMA has crossed above its orange 10-hour EMA (green ellipse) and the RSI is above 50 (blue rectangle). These are bullish developments and suggest an underlying positive momentum. We note that the greenback has almost completed a flag pattern (red parallel trend lines). To complete we need to see a breakout to the upside. A flag pattern is a continuation pattern i.e. the previous impulse up is the dominant direction if the pattern is a true flag. Moreover, flags fly at "half-mast”, which give a price target of 12,513 if realized.

USDOLLAR Bouncing Off Fibonacci Support on H1The USDOLLAR pulled back yesterday after registering as overbought on the daily time frame and running into resistance. Here we take a look at the 1 hour time frame. FXCM's dollar index is bouncing off of the 50% Fibonacci retracement support level. We can also see that the RSI has moved above 50 (blue rectangle), which is the bullish side of the oscillator. This may be indicative of a possible shift to an underlying bullish momentum. We are now looking to see if the green 5-hour EMA crosses above the orange 10-hour EMA and develops angle and separation (aqua ellipse). If so, these will be regarded as bullish developments.

USDOLLAR Runs into Resistance; Oscillators due to NormaliseHere we see the daily chart of FXCM's USDOLLAR index. We note that the green 5-day EMA is above the orange 10-day EMA with good angle and separation. This is indicative of the strong upwards momentum of the greenback. However, technically, the index has run into overhead resistance (red shaded horizontal) at a time when the RSI is overbought (in excess of 80). Furthermore, we can see that the EMAs crossed in early January at about the time the RSI pushed above 50 (aqua ellipses). Thus,the current impulse move is mature and certainly may be close to a correction. If a pullback does chart, it may very well be a buying opportunity. The greenback is a beneficiary of the renewed fears surrounding the spread of the coronvirus, particularity to areas outside of China (we have seen a jump in cases in South Korea and Italy). I.e. the USDOLLAR is currently being utilised as a safe haven and this is likely to continue given the poor choice of alternatives (the JPY seems to have been stripped of this status, at least temporarily. following its 1.6% GDP contraction last week).

Death to your crypto buddyJust try and go against it the force is strong with this one dump the corn and dump those yellow bars

USDOLLAR short entry.USDOLLAR short entry. The exchange started copying a falling fractal. The primary target price is 12351usd


FXCM USD Index not at same level as FuturesNot a very useful chart, but it shows the disparity between the Futures and CFD which is no surprise really

THE FED WILL CONTINUE OMOHello Traders,
The #Federal Reserve will continue to purchase the #Treasury #Bond to ease #volatility in the #Repo market until the Q2. We do expect the $USD to breaklower as the US10 years yield #Bond will push higher. We will be watching $EURUSD for buy opportunity.
Trade with care

Dow Jones Dollar Index is close to the Support/Resistance Zone!We can open Sell under the Support/Resistance Zone.
Reasons:
- the price can bounce down from $ 12353;
- it was four such bounces in the past with good risk-reward ratio;
- potential profit will be 3 times bigger than the risk.
Dear followers, the best "Thank you" will be your likes and comments!
Before to trade my ideas make your own analysis.
Thanks for your support!


Dollar Index (DJ DXY) is near the Support/Resistance Zone...Waiting for an accurate Sell entry under the Support/Resistance Zone.
The false breakout is happened.
Potential profit will be 3 times bigger than the risk.
Push like if you think this is a useful idea!
Before to trade my ideas make your own analyze.
Write your comments and questions here!
Thanks for your support!

USDollarPrice is in demand directly under supply - to go lower price needs to start breaking the support holding it up


USDOLLAR - a Big Rally downtrend* 50% for all predicting.
- Weekly: dow theory for a downtrend.
image]https://www.tradingview.com/x/jyy5urQF/
- Daily: 2 points are supported by the Weekly signal.
- H4: DinhChienFX signal: a sell continue.

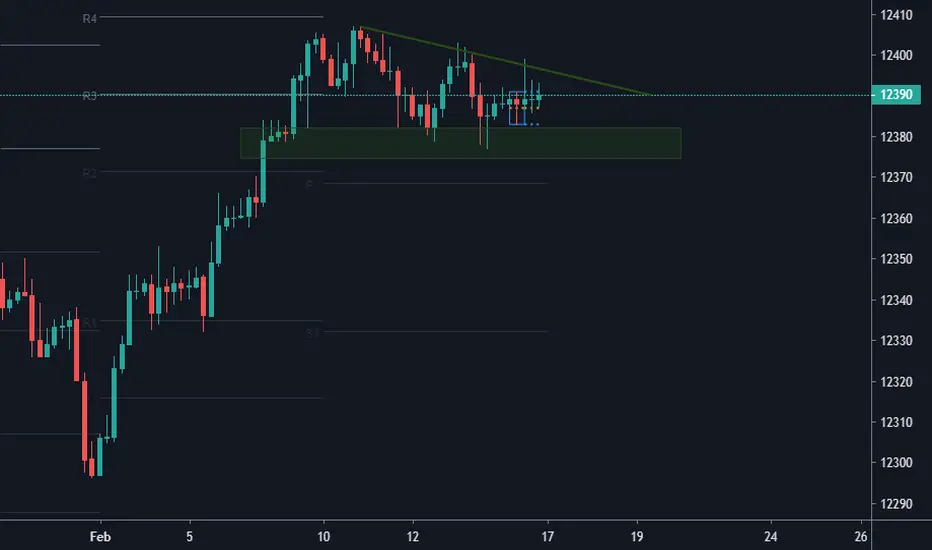
Dollar Index Broken Structure Level !Hi Traders, here is the full analysis / Breakdown for US DOLLAR INDEX.
Keep this pair on your watch-list.
Conditions -
1. Wait for confirmation (Environment Change / Retest Of Structure & Confirmation of Bearish trend)
2.Use Risk Management (Risk 1% of your capital)
3.Do your Own analysis
4.Follow for more Analysis like this !
Dont forget to give me a like & Follow , let me know in the comment section below if you have any questions.
See You in the next Video / Analysis
Global Fx Education Team

Dollar Index, Fall after the pullback..The price bounced from the Support/Resistance Zone after the pullback and can fall down again.
This is not strong zone but it there is some price reaction on lower timeframe.
Push like if you think this is a useful idea!
Before to trade my ideas make your own analyze.
Write your comments and questions here!
Thanks for your support!
