USDOLLAR 4hr Analysis Supply And Denandlooking here at the usdollar 4hr chart. price has created new demand area. looking at a stronger usd here at this usdollar level. All pairs with USD will be on my radar 2 see if i can use it as a correlation.
USDOLLAR trade ideas


USDOLLAR LONGFree Telegram: t.me
Important support zone;
Bullish divergence forming (price and rsi);
volumes on macd are decreasing.
1/2 size for this trade

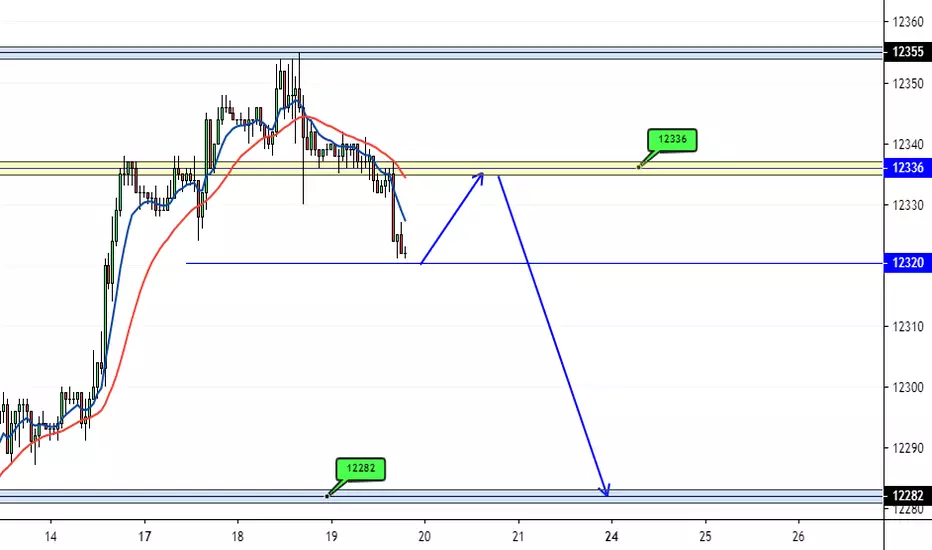
DOW JONES (US DOLLAR INDEX) - 60MIN - SHORT ENTRY : PULLBACK TO 12336
STOP LOSS : AS PER TRADER RISK MANAGEMENT
TARGET : 12282


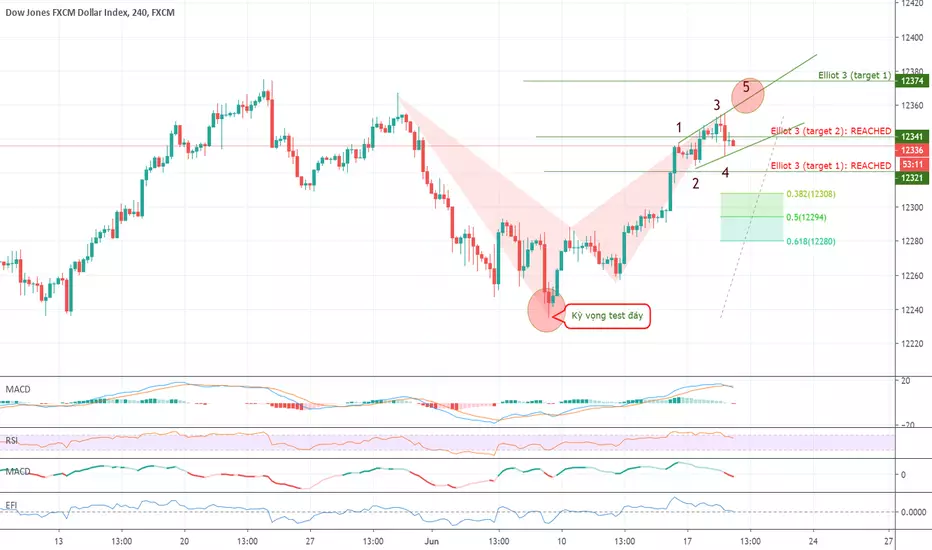
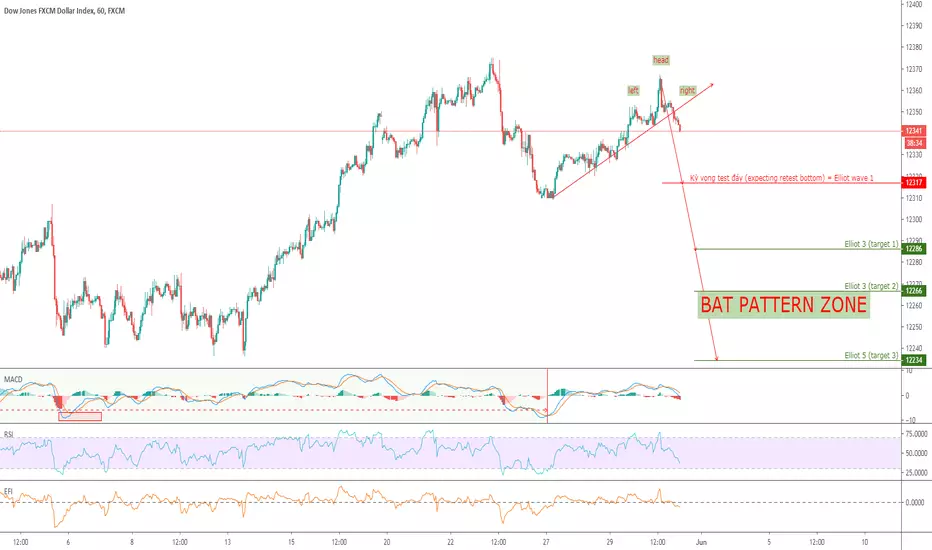
USDOLLAR - Short at Bat Pattern- Daily: expect to test the bottom.
- H4: being in Elliot 3 wave zones and Bat Pattern. However, RSI still shows signs of testing the old peak H4.
- H1: there was a downward force.
* Target 1, 2, 3: 38.2, 50, 61.8.
USDOLLAR - expecting to retest the bottom and new bottom.- Trading key: 50/50% for all forecast.
- Always stop loss for the next opportunities.
Thanks for your like, comment and sharing.

Usd Index, Could 12262 Hold??
Per the CPI news that came from the US economy, It pushed price to the downside below the 12262 support but later closed above the psychological level of the same 12262 region. Hence there is a potential move to the upside of 12316 region. Thus anticipating some level of dollar strength coming in across the major usd pairs.


USD usdollar supply and demand analysisplease refer bck to photo for analysis. but we are in a weekly uptrend and price is back into weekly demand.
comments welcome...cheers

Possible Move DownThe Index seems to have finished the B wave of the 3 wave ABC corrective pattern. It is highly likely that the index will now make a C wave, going down to retest the levels close to A. Once this correction is done, it could continue to move up. In the short term, I am looking at the index making one move down from the current levels.


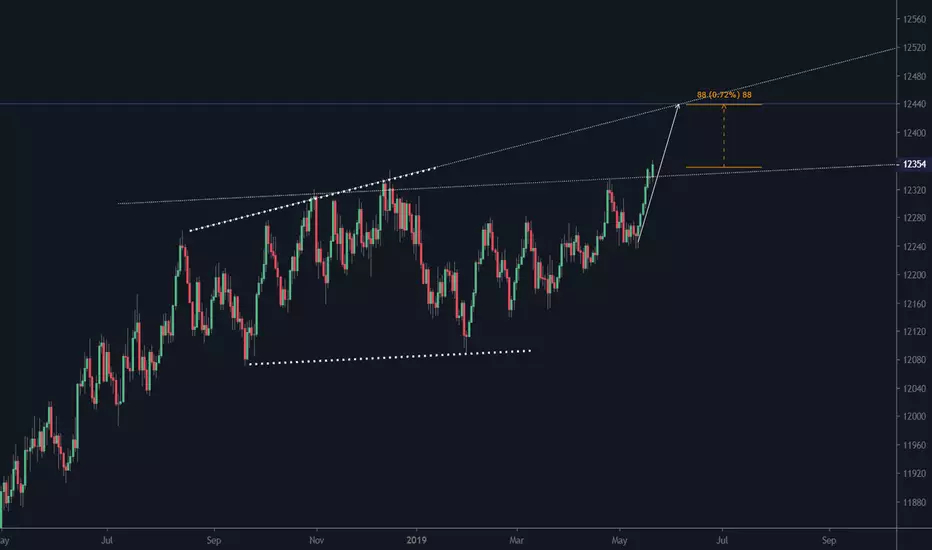
USDOLLAR before 0.72% increase. The exchange rate builds a rising wave structure. The target price is 12435
USDOLLAR: Long Opportunity Inverse Head&ShoulderTrend continuation trade.
USDOLLAR completed an inverse Head&Shoulder pattern. Price closed above 200 EMA and created a small 60 min flag.
TP1 - Harmonic pattern AB=CD
TP2 - Alternate Harmonic pattern 1.27AB=CD
Good Luck!

SHORT DOW JONES FXCM DOLLAR INDEX WEEKLYSHORT DOW JONES FXCM DOLLAR INDEX WEEKLY
TP : 12035 ~ 12090
FX:USDOLLAR


USDOLLAR - drop with 5 wave ElliotDaily: 3 days break down.
H4: MACD & RSI confirm a down trend.
H1: correct to value zone.

USDOLLAR(daily). Bearish Gartley, AB=CD, at Fib res.USDOLLAR(daily). Bearish Gartley, AB=CD, at Fib res.

