DXY,DAILYweek ended with a daily bullish engulfing candle forming a HL a sign for more buyers in the market
USDOLLAR trade ideas
THIS IS IDEA FOR USDOLLARLook for a BUY opportunity when the inverted head and shoulder pattern is almost complete.

USDOLLAR: a quick analysisUSDOLLAR (Indices). if the trend breaks the low supply with out going to the higher supply then is the good time to enter the trade, if its not then we need to wait couple of hours to break down and enter the trade safely.
risk management: stop loss on 0.07% lowing chance, take profits on 0.39% incase if you did pre-trade then is 0.78%
Hope this one helps :)


DXY On 4H Timeframe Is A Bullish Trend.DXY On 4H Timeframe Is A Bullish Trend.
Support And Resistance Levels On The Us Dollar : 12500 Support , 13000 Resistance.
Will DXY Go Up Or Down ?
Our Wave Prediction Suggests To Reach 12400 , But If Price Exceeds The Level Of 12862 The Bearish Scenario Will Be Canceled.

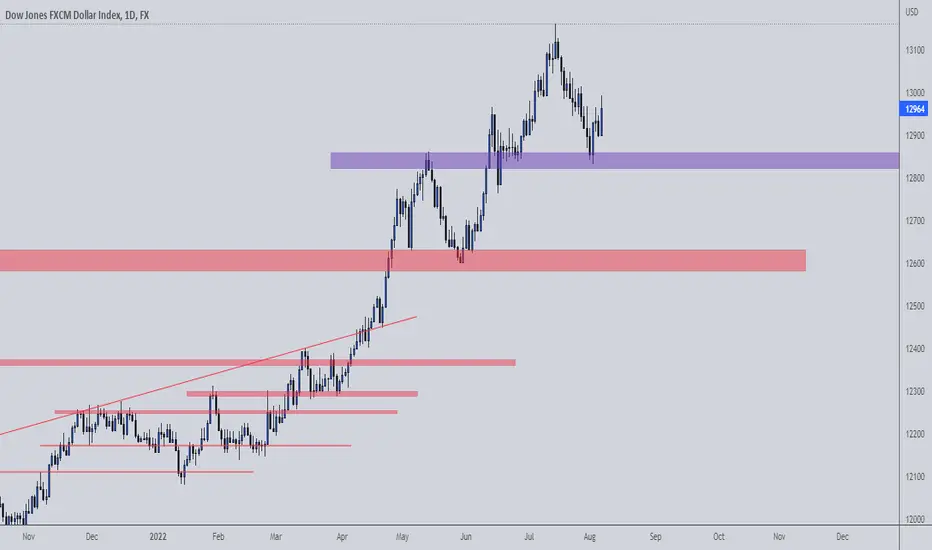
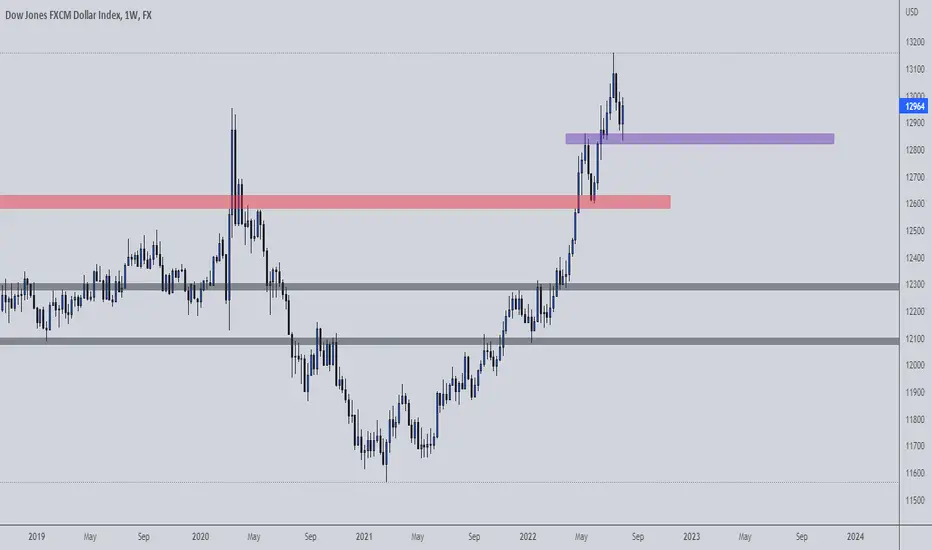
dow jones mid term analysisthere is a divergence beneath the resistance and can be followed as shown in weekly timeframe


UsdollarIt's a long shot, however I do see a bullish trend for the usdollar..Tp for the buy would be the line, swing trade

Is this the end of a cycle?Novice here. Just playing around.
RSI can push higher but I expect the volume range (set at 70%) to be re-entered in the next six to twelve months.
Welcome any feedback in the comments below.
:)

Bull DXYThe dollar it's still ranging on 30m timeframe,I'm expecting it to drop since it failed to make high and made shift in market structure.

Bearish Dollar is losing value I'm expecting it to drop from my point of interest,it failed to make higher high now it will grabs liquidity from that uptredline.

Unfilled GAP on BTC us dollar Unfilled gap on USDOLLAR/Btcusd chart. Will fill
This is on the USDOLLAR/BTCUSD CHART- which is a glitch chart on TV that plays into btc trading constantly

US Dollar Index Bearish?My outlook on US Dollar Index is extremely bearish as it forms a double top pattern on weekly TF & it will make retracement on FIB level 0.618 as shown in the chart below. What this means for crypto? "Relief Rally" : Fingers Crossed:

USDOLLAR for the weekUSDOLLAR has reached an orderblock zone, reversal can happen anywhere around 12836 - 12933. If it doesn’t happen, we will look to see if there would be a break of structure at 12954. By my prediction, BOS is more likely, but we have to be reactive and not predictive. The momentum on Monday should be a signal for the direction. Fingers crossed.

USDOLLAR on D1 TFI expect the previous low at 12630 to be broken before confirming the downtrend. We can still see a short rally up to the resistance at 12931 before continuing to the downside.

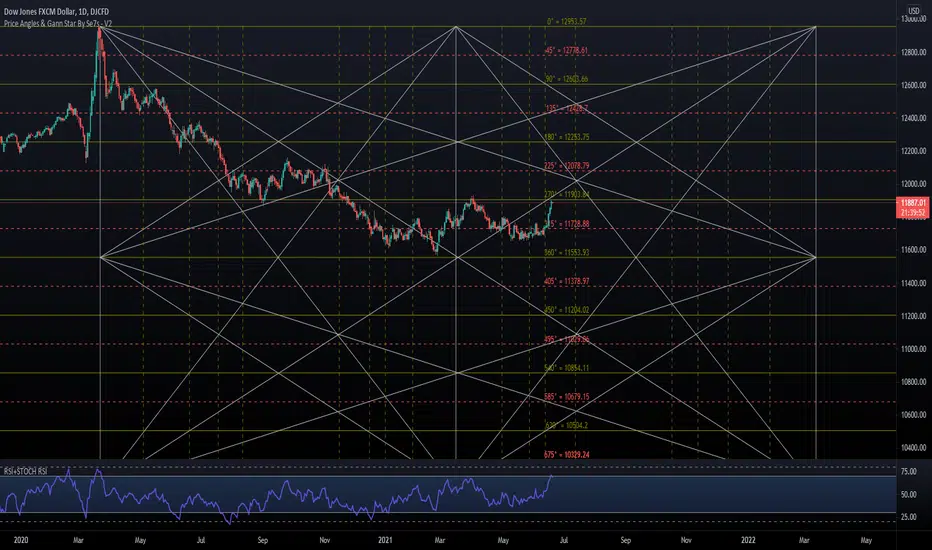
Gann star.support and resistance lines..
horizontal lines are Support/Resistance .
Vertical lines are time pivots .
Appreciate your Comments.
GL

USDOLLAR Retracement SHORT to 0.618 Retracement and lower chUSDOLLAR is set for a pullback to the FIB retracement level 0.618 after testing the upper channel....now ready to trace to the bottom channel and the 0.618

SWEET DOLLAR INDEXHello Traders,
Dollar is still strong but this might be the last bullish leg before a midterm short. I will be bullish on the dollar for next week.
Cheers!

DOLLAR INDEXThe weekly price chart below shows the U.S. Dollar Index rose slightly last week, in line with the long-term bullish trend, printing a bullish doji candlestick, which can be a sign of indecision. However, the lower wick was supported by 12293, so if the price can break last week’s high over the coming week, it will be a bullish sign Dollar bulls will be encouraged that the nearest support level, shown in blue at 12293 within the below price chart, has continued to hold, giving hope that the greenback will resume its advance more strongly.
It may be wise to take trades in favor of the US Dollar in the Forex market over the coming week.

US DOLLAR SHORTFrom my technical analysis, MONTHLY & WEEKLY timeframes are well positioned at the resistance level. Daily timeframe has shifted structure. I will advise you to wait for 4H to change market structure to short.
This is for SWING traders but for shorter term traders, you can adapt this to your strategy.
For next week, I will be looking for long opportunities in Both EURUSD AND GBPUSD. Also a short opportunity in USDJPY.
Cheers fam!
