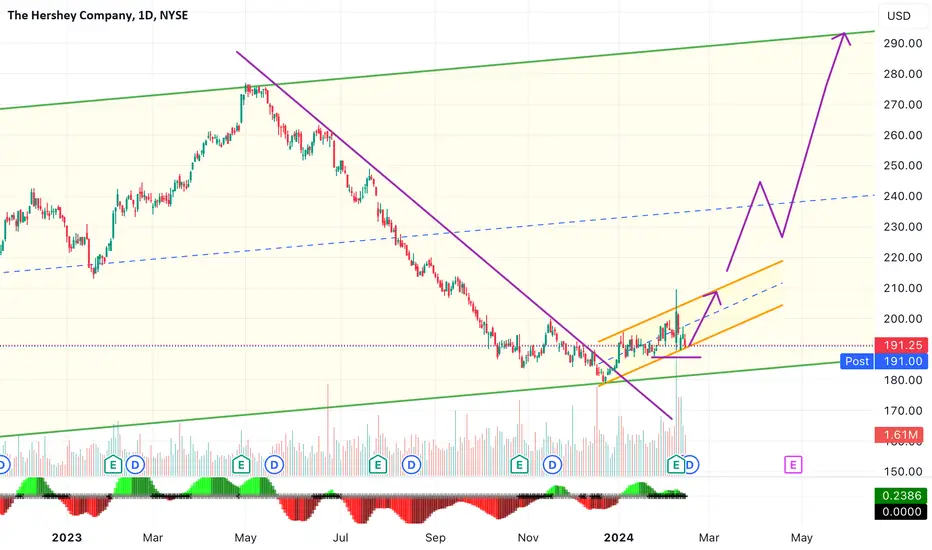
Chocolate makes you happy? Why not have both ? Eat the chocolate and make the profits , haha?
Wait for it or nibble some when it breaches the resistance at 193.53 or wait for it to fall further to the support level at 174.58.....
Christmas is coming ......what other better gifts than chocolate, the old tradition?
Next report date
—
Report period
—
EPS estimate
—
Revenue estimate
—
9.38EUR
1.69 BEUR
10.12 BEUR
147.13 M
About The Hershey Company
Sector
CEO
Michele G. Buck
Headquarters
Hershey
Website
Employees (FY)
20.51 K
Founded
1894
FIGI
BBG000DB9BH8
The Hershey Co. engages in the manufacture and marketing of chocolate, sweets, mints and confectionery products. The firm operates through the following geographical segments: North America and International and Other. The North America is responsible for the traditional chocolate and non-chocolate confectionery market position of the company, as well as its grocery and snacks market positions, in the United States and Canada. The International and Other segment includes the combination of all other operating segments, including those geographic regions where the company operates outside of North America. Its brands include Hershey's, Reese's, and Kisses. The company was founded by Milton S. Hershey in 1894 and is headquartered in Hershey, PA.

Hershey Company - Bullish trend incomingHershey has completed the accumulative range of 6-month after the stock broke out of the range at 204.03 resistance turned support. Prices has also trends above all Ichimoku indicators and is likely to trend higher targeting 227.49, 238.96 and 259.44.
Furthermore, all momentum indicators are showi

Hershey 41924Hershey in a clear bottom of the range and buy zone. I see it moving higher where many are calling it lower bc of cocoa prices. I just see it doing the opposite of what the herd believes. Bullish af on REAL THINGS and chocolate is a huge industry that will grow. When times get tough, ppl always seek

Hershey: IHS and A Chocolate DividendFundamentals:
I am not relying on fundamental analysis for this stock, but only technical analysis.
Technicals:
Daily:
Inverse Head and Shoulders pattern
Stage 3
uRd
Weekly:
uRd

Short $HSY short opportunity for NYSE:HSY ?
NYSE:HSY looks like a great short opportunity to me for the following reasons:
- Apparent stage four decline (stage analysis)
- Bear flag chart pattern on all time frames, especially longer-term.
- Fibonacci confluence.

Time to load up on this counter - HSYIt has come down more than 33% from its peak and the staggering high cocoa price has not help in the share price at all.
Support zone (buying zone) is around 170-183 price level which I will start buying slowly.
Please DYODD

A good chocolates Earnings was not so exiting because of cocoa overpriced
Price near lower border of short term channel up can be a good entry point with a target of 207$ next week
Can also be interesting under a long term view
Hershey Company Unveils Aggressive Cost-Cutting MeasuresThe Hershey Company (NYSE: NYSE:HSY ) has announced a two-year restructuring program aimed at generating substantial cost savings. This initiative comes in response to recent quarterly performance that fell short of Wall Street expectations, coupled with concerns about consumer spending trends and r


HSY LONG IDEALong term trade idea on HSY. Support tested multiple times at 200 SMA. Great time to enter now

See all ideas
Trade directly on the supercharts through our supported, fully-verified and user-reviewed brokers.


Curated watchlists where HSY is featured.


Frequently Asked Questions
The current price of HSY is 185.66 EUR — it has decreased by 2.23% in the past 24 hours. Watch US4278661081 stock price performance more closely on the chart.
Depending on the exchange, the stock ticker may vary. For instance, on HAN exchange US4278661081 stocks are traded under the ticker HSY.
HSY stock has fallen by 2.96% compared to the previous week, the month change is a 6.33% rise, over the last year US4278661081 has showed a 23.82% decrease.
We've gathered analysts' opinions on US4278661081 future price: according to them, HSY price has a max estimate of 219.92 EUR and a min estimate of 156.43 EUR. Watch HSY chart and read a more detailed US4278661081 stock forecast: see what analysts think of US4278661081 and suggest that you do with its stocks.
HSY stock is 2.28% volatile and has beta coefficient of 0.50. Track US4278661081 stock price on the chart and check out the list of the most volatile stocks — is US4278661081 there?
Today US4278661081 has the market capitalization of 37.60 B, it has increased by 3.32% over the last week.
Yes, you can track US4278661081 financials in yearly and quarterly reports right on TradingView.
US4278661081 is going to release the next earnings report on Jul 25, 2024. Keep track of upcoming events with our Earnings Calendar.
HSY earnings for the last quarter are 2.85 EUR per share, whereas the estimation was 2.56 EUR resulting in a 11.19% surprise. The estimated earnings for the next quarter are 1.35 EUR per share. See more details about US4278661081 earnings.
US4278661081 revenue for the last quarter amounts to 3.01 B EUR despite the estimated figure of 2.88 B EUR. In the next quarter revenue is expected to reach 2.15 B EUR.
HSY net income for the last quarter is 739.07 M EUR, while the quarter before that showed 316.24 M EUR of net income which accounts for 133.71% change. Track more US4278661081 financial stats to get the full picture.
Yes, HSY dividends are paid quarterly. The last dividend per share was 1.26 EUR. As of today, Dividend Yield (TTM)% is 2.38%. Tracking US4278661081 dividends might help you take more informed decisions.
US4278661081 dividend yield was 2.39% in 2023, and payout ratio reached 49.20%. The year before the numbers were 1.67% and 48.65% correspondingly. See high-dividend stocks and find more opportunities for your portfolio.
As of May 24, 2024, the company has 20.51 K employees. See our rating of the largest employees — is US4278661081 on this list?
EBITDA measures a company's operating performance, its growth signifies an improvement in the efficiency of a company. US4278661081 EBITDA is 2.88 B EUR, and current EBITDA margin is 27.96%. See more stats in US4278661081 financial statements.
Like other stocks, HSY shares are traded on stock exchanges, e.g. Nasdaq, Nyse, Euronext, and the easiest way to buy them is through an online stock broker. To do this, you need to open an account and follow a broker's procedures, then start trading. You can trade US4278661081 stock right from TradingView charts — choose your broker and connect to your account.
Investing in stocks requires a comprehensive research: you should carefully study all the available data, e.g. company's financials, related news, and its technical analysis. So US4278661081 technincal analysis shows the neutral today, and its 1 week rating is neutral. Since market conditions are prone to changes, it's worth looking a bit further into the future — according to the 1 month rating US4278661081 stock shows the neutral signal. See more of US4278661081 technicals for a more comprehensive analysis.
If you're still not sure, try looking for inspiration in our curated watchlists.
If you're still not sure, try looking for inspiration in our curated watchlists.