KMI Contrarian PUT Trade – AI vs Market Flow | High RiskKMI Earnings Signal | 2026-01-21
📊 TRADE DETAILS 📊
🎯 Instrument: KMI
🔀 Direction: PUT (SHORT)
🎯 Strike: 28.50
💵 Entry Price: 0.33
🎯 Profit Target: 0.66
🛑 Stop Loss: 0.17
📅 Expiry: 2026-01-23
📏 Size: 1.0
📈 Confidence: 55%
⏰ Entry Timing: N/A
🕒 Signal Time: 2026-01-21 13:15:52 EST
WARNING: Use only
Next report date
—
Report period
—
EPS estimate
—
Revenue estimate
—
1.37 USD
3.06 B USD
16.94 B USD
1.94 B
About Kinder Morgan, Inc.
Sector
Industry
CEO
Kimberly Allen Dang
Website
Headquarters
Houston
Founded
1997
IPO date
Feb 10, 2011
Identifiers
3
ISIN US49456B1017
Kinder Morgan, Inc. engages in providing pipeline transportation of natural gas services. It operates through the following business segments: Natural Gas Pipelines, Products Pipelines, Terminals, and CO2. The Natural Gas Pipelines segment operates major interstate and intrastate natural gas pipelines and storage systems. The Products Pipelines segment is involved in the operation of refined petroleum products, crude oil, and condensate pipelines. The Terminals segment includes the operation of liquids and bulk terminal facilities that store and handle various commodities. The CO2 segment produces, transports, and markets to oil fields that use CO2 as a flooding medium to increase recovery and production of crude oil from mature oil fields. The company was founded by Richard D. Kinder and William V. Morgan in February 1997 and is headquartered in Houston, TX.
Related stocks

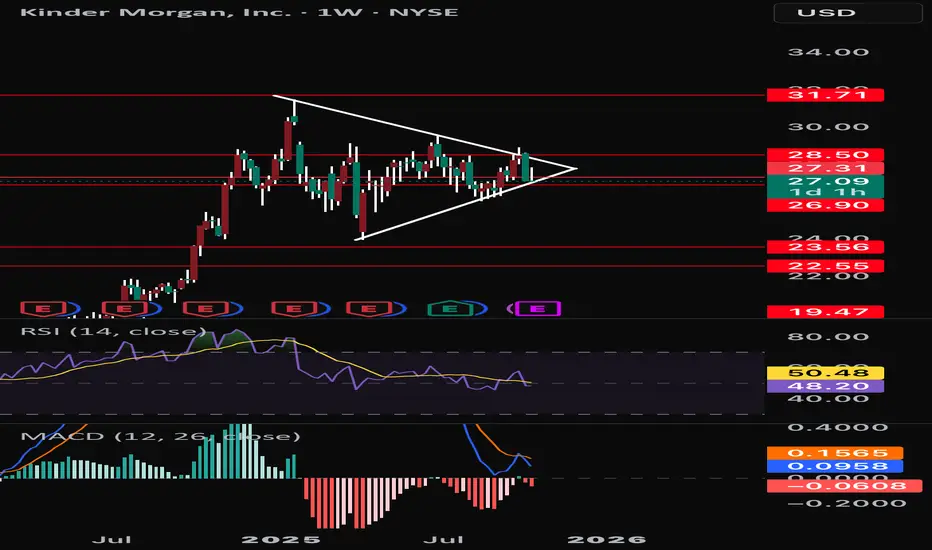
KMI LongTrendline break
Long entry 26.9
Stop 25.5
Target 31, 44 (weekly target)
Risk management is much more important than a good entry point.
I am not a PRO trader.
In my trading plan, the Max Risk of each short term trade should be less than 1% of an account.

KMI in a triangleBouncing in a triangle and at the bottom could hold or break, but regardless looking at follow through and not breaking, more data needed but could make a good conservative stop loss under the triangle
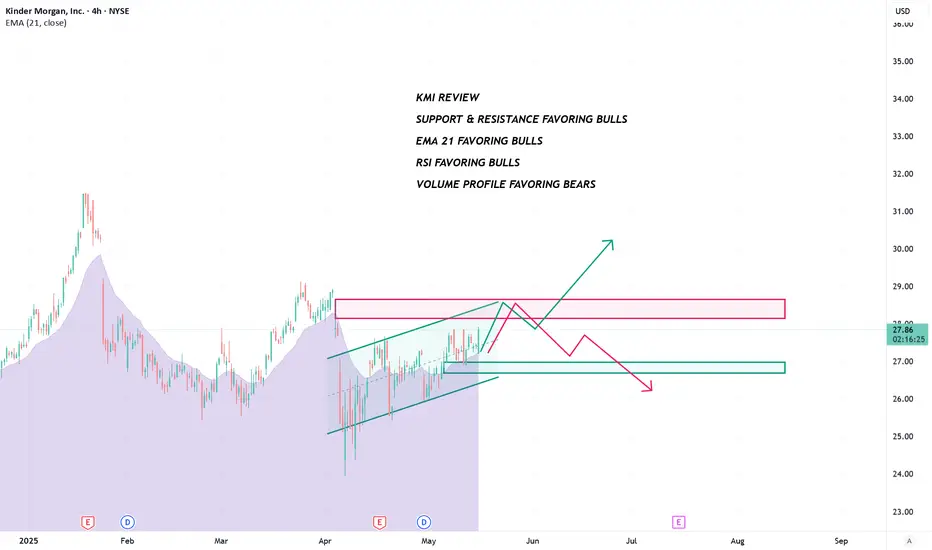
KMI - Bull or BearGood Morning,
Hope all is well chart shows it best. EMA 21 with some strong bullish momentum, probably enough to get us over that next line of resistance.
KMI good dividend play.
ENJOY!
Expect a break out above 23KMI involves pipeline transportation of natural gas services was in bearish trend after touching 44 in 2015. During covid 2020, it touched a low of 9 and its been consolidating between 14 to 20. With dividend yield of above 4%, its good candidate to buy and hold for 2-3 years for a target of 31.

KMIFundamental Analysis of Kinder Morgan, Inc. (KMI)
1. Macroeconomic Factors
• Energy Demand & Natural Gas Market:
• Kinder Morgan, as one of the largest energy infrastructure companies in North America, benefits from increasing demand for natural gas.
• The transition toward cleaner energy source

KMI, Buy opportunity As evident on the chart, the correction has concluded at the 50-61.8 Fibonacci retracement level. Additionally, the price is breaking out above a descending trend line and a minor resistance level. In my opinion, once we receive confirmation of a breakout above this level, it may present a compellin

$KMI with a bullish outlook following its earnings #StocksThe PEAD projected a bullish outlook for NYSE:KMI after a negative over reaction following its earnings release placing the stock in drift C with an expected accuracy of 66.67%.

KMI potential uptrend continuationKMI, a stock that’s rather under the radar has been gradually climbing as of last week broken out of a 2 month consolidation and is looking to continue its trend moving higher. Forming a solid confirmation candle last Friday, I will be setting a pending order around its highest trading price of $21.

Kinder Morgan: Slanted Bullish Inverted Head and ShouldersKinder Morgan is heading into earnings and currently sits above the 200-week SMA and the POC as it forms what appears to be a Bullish Inverted Head and Shoulders pattern. If these levels hold into earnings, I think KMI will have a chance at breaking out of the pattern and making its way towards the

See all ideas
Summarizing what the indicators are suggesting.
Neutral
SellBuy
Strong sellStrong buy
Strong sellSellNeutralBuyStrong buy
Neutral
SellBuy
Strong sellStrong buy
Strong sellSellNeutralBuyStrong buy
Neutral
SellBuy
Strong sellStrong buy
Strong sellSellNeutralBuyStrong buy
An aggregate view of professional's ratings.
Neutral
SellBuy
Strong sellStrong buy
Strong sellSellNeutralBuyStrong buy
Neutral
SellBuy
Strong sellStrong buy
Strong sellSellNeutralBuyStrong buy
Neutral
SellBuy
Strong sellStrong buy
Strong sellSellNeutralBuyStrong buy
Displays a symbol's price movements over previous years to identify recurring trends.
S
EPB4464269
Southern Natural Gas Company 4.8% 15-MAR-2047Yield to maturity
6.38%
Maturity date
Mar 15, 2047
See all KMI bonds
Frequently Asked Questions
The current price of KMI is 30.50 USD — it has increased by 0.63% in the past 24 hours. Watch Kinder Morgan, Inc. stock price performance more closely on the chart.
Depending on the exchange, the stock ticker may vary. For instance, on NYSE exchange Kinder Morgan, Inc. stocks are traded under the ticker KMI.
KMI stock has risen by 0.53% compared to the previous week, the month change is a 13.50% rise, over the last year Kinder Morgan, Inc. has showed a 10.07% increase.
We've gathered analysts' opinions on Kinder Morgan, Inc. future price: according to them, KMI price has a max estimate of 38.00 USD and a min estimate of 28.00 USD. Watch KMI chart and read a more detailed Kinder Morgan, Inc. stock forecast: see what analysts think of Kinder Morgan, Inc. and suggest that you do with its stocks.
KMI stock is 1.16% volatile and has beta coefficient of 0.47. Track Kinder Morgan, Inc. stock price on the chart and check out the list of the most volatile stocks — is Kinder Morgan, Inc. there?
Today Kinder Morgan, Inc. has the market capitalization of 67.86 B, it has increased by 2.27% over the last week.
Yes, you can track Kinder Morgan, Inc. financials in yearly and quarterly reports right on TradingView.
Kinder Morgan, Inc. is going to release the next earnings report on Apr 22, 2026. Keep track of upcoming events with our Earnings Calendar.
KMI earnings for the last quarter are 0.39 USD per share, whereas the estimation was 0.36 USD resulting in a 6.90% surprise. The estimated earnings for the next quarter are 0.37 USD per share. See more details about Kinder Morgan, Inc. earnings.
Kinder Morgan, Inc. revenue for the last quarter amounts to 4.51 B USD, despite the estimated figure of 4.32 B USD. In the next quarter, revenue is expected to reach 4.56 B USD.
KMI net income for the last quarter is 996.00 M USD, while the quarter before that showed 624.00 M USD of net income which accounts for 59.62% change. Track more Kinder Morgan, Inc. financial stats to get the full picture.
Yes, KMI dividends are paid quarterly. The last dividend per share was 0.29 USD. As of today, Dividend Yield (TTM)% is 3.82%. Tracking Kinder Morgan, Inc. dividends might help you take more informed decisions.
Kinder Morgan, Inc. dividend yield was 4.24% in 2025, and payout ratio reached 84.75%. The year before the numbers were 4.18% and 97.84% correspondingly. See high-dividend stocks and find more opportunities for your portfolio.
EBITDA measures a company's operating performance, its growth signifies an improvement in the efficiency of a company. Kinder Morgan, Inc. EBITDA is 7.18 B USD, and current EBITDA margin is 42.29%. See more stats in Kinder Morgan, Inc. financial statements.
Like other stocks, KMI shares are traded on stock exchanges, e.g. Nasdaq, Nyse, Euronext, and the easiest way to buy them is through an online stock broker. To do this, you need to open an account and follow a broker's procedures, then start trading. You can trade Kinder Morgan, Inc. stock right from TradingView charts — choose your broker and connect to your account.
Investing in stocks requires a comprehensive research: you should carefully study all the available data, e.g. company's financials, related news, and its technical analysis. So Kinder Morgan, Inc. technincal analysis shows the strong buy rating today, and its 1 week rating is buy. Since market conditions are prone to changes, it's worth looking a bit further into the future — according to the 1 month rating Kinder Morgan, Inc. stock shows the strong buy signal. See more of Kinder Morgan, Inc. technicals for a more comprehensive analysis.
If you're still not sure, try looking for inspiration in our curated watchlists.
If you're still not sure, try looking for inspiration in our curated watchlists.