BTCUSD retest 70k?While the price of bitcoin continues to be undervalued, i genuinely think we see a bullish rally back to 70k, while this isn’t the usual ideal trade I’ve been long since day candle open and so far so good. I will wait and see if price holds till we hit 70k.
MBTCUSD trade ideas

Bitcoin: Soon to Break 90k Equilibrium PointUnveiling Bitcoin's Macro Trajectory: A Data-Driven Approach
This analysis takes a long-term view of Bitcoin's potential, leveraging Goldbach's Conjecture (PO3 number 177147) to identify key accumulation and breakout zones.
Past Performance Informs Future Potential:
June 2022 – March 2023: A prolonged consolidation period aligns perfectly with Goldbach's Order Block zone, suggesting a period of strategic accumulation.
Catalysts Fueling the 2023 Surge:
August 2023 – January 2024: Speculation surrounding ETF approval, AI integration, and rising institutional involvement fueled a significant rally, creating a "liquidity void" within Goldbach's levels.
Current Market Positioning: A Discount Opportunity?
Despite recent gains, the current price remains within the "Bargain and Range" (BR) zone, well below equilibrium levels (estimated at $88,437-$90,000). This suggests a potential discount window for long-term investors.
Predicting the Next Move: A Data-Driven Approach
If Goldbach's framework holds true, Bitcoin is poised for a significant upswing, potentially reaching $99,000 near the "Mitigation Block" (MB) in the near future.
Conclusion:
This data-driven analysis offers a unique perspective on Bitcoin's macro trajectory, highlighting potential buying opportunities and future price movements based on historical accumulation patterns and Goldbach's Conjecture.
Further Reading: Goldbach Trading Basic Guide
This guide introduces the basics of Goldbach trading, a technical analysis method that uses Fibonacci numbers (specifically powers of three) to define price action in financial markets.
Key Concepts
Dealing Ranges: Goldbach theory suggests that price movements occur within predefined price ranges based on powers of three. These ranges are fractal, meaning they exist on all timeframes.
PDAs (Premium Discount Arrays): These are zones where price is more likely to find support or resistance. Goldbach defines specific locations within a dealing range for these zones.
Rejection Block: Area where price is likely to be rejected.
Order Block: Area where large orders are placed, creating support or resistance.
Fair Value Gap: Price gap that is likely to be filled.
Equilibrium: Price level where buying and selling pressure are balanced.
Algorithms: The instructor mentions two algorithms (Algo 1 and Algo 2) for entering and exiting trades based on Goldbach principles.
Benefits of Goldbach Trading
Precise Entry and Exit Points: Goldbach aims to identify high-probability entry and exit zones based on predefined price levels.
Improved Risk Management: Knowing potential support and resistance areas can help traders manage risk more effectively.

Buyers Defending BTC at $65000Buyers are defending BTC at $65000 levels after a break of HS at $67000 levels. $65000 level was tested ones on 16 May 24 and recently 15 Jun 24. It was also 1 Apr 21 ATH. If broken, more to the downside.
Crypto & Portfolio market are in the endo f B waveAccording to my waves count the market top was in November 2021.
Decline belowe 44k will confirm we are in C wave. The target of wave C might be at least 18500k.
However, the structure of this formation may have a more complex form. This may turn out to be a Zigzag. The exit from such a zigzag may last until 2028.
This scenario is canceled if the price closes above 74 thousand

$BTC may have a very short term bounceBullish divergence is formed in lower time frame #bitcoin #btc chart. Minor bounces may be necessary. Not financial advice.

Bitcoin has potential, long term analysis gives a clear indicatiBitcoin looks like its gonna go all the way up, wont go into detail as this is a long term setup however, be prepared for retracements as it looks like it has a great potential of falling maybe under $65 000, long term analysis has a clear indication of a bullish trend however I personally dont advice people to trade but to buy and hold coins as risk is more calculated that way


BTC - POSSIBLE LONG TERM SCENARIO (JAN 2024)This is my first post in 2024.
BTC - POSSIBLE LONG TERM SCENARIO (JAN 2024)
This is what I see BTC in a big picture at the moment. The lowest I anticipate (if happens) would be 36k. Moreover, BTC can correct when reaches around 48k. The top also can be around 150k in 2025. Let's see what will happen.

BTC Price prediction next 8 months We are entering a fear factor. All this with a daily M formation about to be completed. I see a crash coming for July or August. My general thought is That with the state of the world and US Elections, I am not being political here, Just facts that political events help move markets. I base this on my own political study of the behavior of different types of political parties and how they react to situations that cause markets to react. But as to stay in line with the TOS of TradingView I can't explain any more than what I have said. The point is, that we are finishing an M, and Political tension and world events always move markets. So I'm 90% sure we will go down 50k 40k range. As for the last move up for the bull run 2025, 26. IMHO If Biden is reelected we could see a very slow climb up or even a 2nd crash to 30k, On the other hand, If Trump wins I think we see a very fast race to the top 85k 120k. Again this is based on my own study of how people act and that makes people buy or sell. And because Wall Street and Politicians are heavily invested in BTC they fule the whale moves. RECAP, down to 50k by end of August 2024. Up to 85k by end of February 2025 Yes we can fall to 30k, yes it can go to 120k, NO it will not go higher this bull run. If it was to, we would already have a high of 85K .

all you need to knowSpeaks for itself. No need for boring talk about waves, fibs, wyckoff etc. This single signal works always.
Good luck.


BTC-USD | 4H | SHORT | TECHNICAL CHARTHello traders, there are very few successful people in this business. Please do not believe or trust every trader and chart that comes your way.
I have set my target on the chart. Those of you who know me know that my targets will always reach their target. Drawings are very important in this business. If you make the right drawings, you will reach your goals.
Dear friends, I think there will be purchases from the BTC fibonacci 0.618 level.
But if you want to receive continuous updates under this post, there must be at least 50 likes.
Thank you to all the traders who support me by like.
I wish you a happy trade.
Regards, Love.

Bitcoin Continuing Micro Wave C of Y
Bitcoin should continue declining until we can count five waves inside micro wave C. However, as prices are already closing in on the potential targets of 50% or 62% retracement, if any trade is entered now, it should have a low reward-to-risk multiple to avoid prices turning around before your profit target is hit.

BTC Bitcoin targeting 62000Hello traders
I am short on BTC based on this chart with expected wave 🌊 shape
stop-loss close 4H above 67000
CRYPTO:BTCUSD

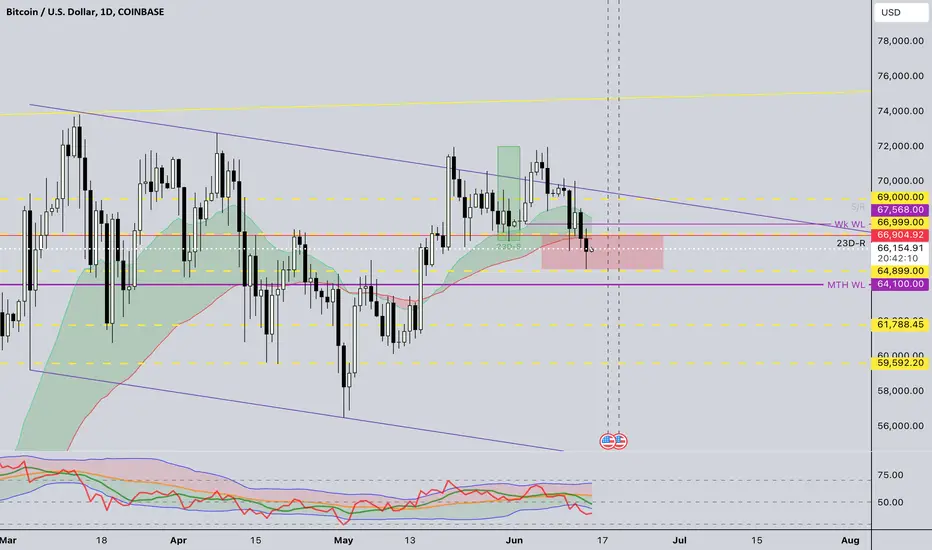
BTC: June 14th, 2024Hello dear traders. Let's cut to the chase.
There's no denying that price is weak and seems in desperate need of a new narrative or momentum.
Technically, price is showing weakness in the mid-range, which is in line with the POC of the range as well. Momentum h4 EMAs (12, 21) are rolling over as well. The positive thing at this point is the bullish absorption that is unfolding. In fact, it has been more or less so throughout the whole range. Apparently, a lot of bitcoins are changing hands.
My thesis is in line with the context, i.e. range-bound price action. I will play the range until the break. Why the local bullish bias? We have a couple of nPOC prints above. Also, the move from sub 60K to 70K is impulsive to me, and I believe we are in the process of putting in a higher low. Plus, if you trade with the flow, the previous quarterly value area high aka pqvah is at 66K while the current quarterly vwap is creeping higher and closer to this level (Find the picture in the comments section). I usually use flow for the daily chart and mid-term bias. As long as 66K is held, my bias is bullish with a move towards the EQ highs at the top of the range. If 66K is lost with a daily candle and strength, I will look at 64K or even 62K. I try to to manage my risk, and stick to the facts. I hope you do the same, and bear in mind that this post is not financial advice, so DYOR.
If you like the idea, please share and smash the like button.

BTCUSD Potential Bullish Bat PatternOn the daily chart, BTCUSD has formed a double top pattern, and the short-term bearish trend is dominant. At present, we can pay attention to the support near 66000. If it falls below, it is expected to fall further, and the downward target is around 61500. When BTCUSD reaches 61500, we can pay attention to the potential buying point of the bullish bat pattern. At the same time, this position is in the previous demand area.

14 June options delivery data 20,000 BTC options expired with a Put Call Ratio of 0.49, a maximum pain point of $68,500 and a notional value of $1.35 billion.
200,000 ETH options expired with a Put Call Ratio of 0.36, a max pain of $3,600 and a notional value of $710 million.
This week is a big macro week, the economic data is more favourable to the market, the U.S. stock market rose significantly, but the crypto market underperformed, the mainstream coins as a whole fell, the altcoins are even more down.
There are fewer hot spots in the market recently, and the market is relatively quiet.
Now BTC each major short term IV is below 50%, ETH each major short term IV is below 60%, both have fallen to a lower level, the buyer is more cost-effective.
There should be news on ETH ETF approval by the end of this month, so it is good time to layout next month call options in advance.

BTC Cheat Sheet FinaleThis is a fresh chart update of BTC's cheat sheet idea and tracking TA, following 2013 to 2017 Bars pattern along with key macro trendlines. April fools edition!

Bitcoin likely pass resistance same as past with double bottoms Personal idea: So far in the case of resistance, Bitcoin creating double bottoms and pass the resistance from 25k till now, as the chart shows same pattern is forming, if happened, we will see huge upward movements will 30% growth. Good 🙂 luck 👍

Crypto in global perspectiveAccording to my waves count the market top was in November 2021.
Decline belowe 44k will confirm we are in C wave. The target of wave C might be at least 18500k.
However, the structure of this formation may have a more complex form. This may turn out to be a Zigzag. The exit from such a zigzag may last until 2028

Short term buy on bitcoin Buy stop on bitcoin activated.
Stop loss is our friend here.
Buy with caution!

Bitcoin bullish outlookI like how Bitcoin is respecting the support I have marked out. Off we can end the day with a string bullish candle to give a bullish engulfing I would like to see price go back to the highs. Maybe break them and retrace and continue the bullish trend

(BTC) bitcoinnot sure what I created here; the indicator line shows slope information that leads before the price increases in the future. may have something to do with the halving and reduction in BTC. the green line decreases as the price grows in the same way a previous chart prices look smaller as the price reaches higher. the only difference here is that the graph lines are happening before the price of BTC peaks, odd. ...now I have to wait to see if the indicator line changes dramatically ahead of the price of BTC...
