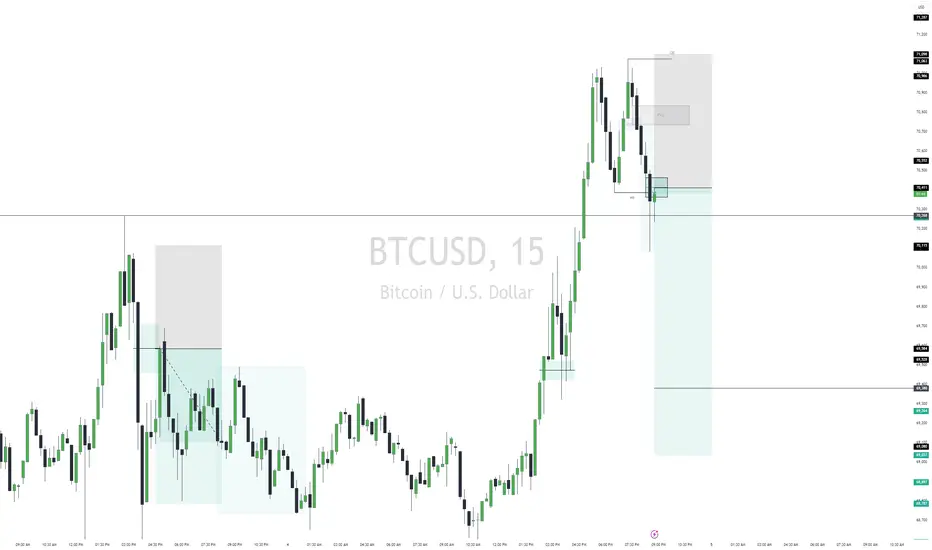
WHALE ENTRY's5 candlestick blocks. Price prediction to $70,883. I'm testing this new strategy. Smart Money Value line. Trend passes the contraction value line. The next contraction is around $72k zone.
MBTCUSD trade ideas

June 5 Bitcoin Bybit chart analysisHello
It's a Bitcoinguide.
If you have a "follower"
You can receive comment notifications on real-time travel routes and major sections.
If my analysis is helpful,
Please would like one booster button at the bottom.
Bitcoin 30-minute chart.
Based on tonight’s 30-minute chart
There are two indicator announcements at 9:30 and 11:00.
According to Nasdaq flow and Tether dominance movement
I created a strategy.
There's a lot of complicated stuff to explain, so I'll keep it very simple today.
*Red finger movement path
One-way long position strategy
1. $70698 long position entry zone / stop loss when breaking out of the green support line
2. $72446.5 long position 1st target -> Good 2nd target
Section 1 at the top is lateral to the right.
Section 2 at the bottom moves sideways to the right.
From the point of departure from section 2, the pattern is broken.
There is a possibility of further adjustment.
The vertical line on the right is because tomorrow is a holiday.
I have left a drawing based on the daily chart being generated on Friday, June 7th.
If you drag up or down
You can check support and resistance prices that are not visible on the chart.
As mentioned in the Good section,
This is the section where Bitcoin exceeds 100 million again.
After the rebound on Nasdaq today
There is a high possibility that there will be a downward movement.
If this movement is an upward wave, or even if it is only a sideways movement,
The beat can rise strongly.
Please watch to see if Tether dominance is connected to a vertical decline.
Because tomorrow is a holiday
I'll take a break tomorrow and see you on Friday.
Please note that my analysis up to this point is merely for reference and use.
I hope you operate safely with principled trading and stop loss required.
thank you

BTCUSDTWe are completing the triangle, after completing the final wave, I expect the price of wave 5 to rise

Bullish bounce off 38.2% Fibonacci support?BTC/USD is falling towards a support level which is a pullback support that lines up with the 38.2% Fibonacci retracement and could bounce from this level to our take profit.
Entry: 69,678.11
Why we like it:
There is a pullback support level which lines up with the 38.2% Fibonacci retracement.
Stop loss: 68,439.59
Why we like it:
There is a pullback support level which lines up with the 61.8% Fibonacci retracement.
Take profit: 71,960.46
Why we like it:
There is a pullback resistance level.
Please be advised that the information presented on TradingView is provided to Vantage (‘Vantage Global Limited’, ‘we’) by a third-party provider (‘Everest Fortune Group’). Please be reminded that you are solely responsible for the trading decisions on your account. There is a very high degree of risk involved in trading. Any information and/or content is intended entirely for research, educational and informational purposes only and does not constitute investment or consultation advice or investment strategy. The information is not tailored to the investment needs of any specific person and therefore does not involve a consideration of any of the investment objectives, financial situation or needs of any viewer that may receive it. Kindly also note that past performance is not a reliable indicator of future results. Actual results may differ materially from those anticipated in forward-looking or past performance statements. We assume no liability as to the accuracy or completeness of any of the information and/or content provided herein and the Company cannot be held responsible for any omission, mistake nor for any loss or damage including without limitation to any loss of profit which may arise from reliance on any information supplied by Everest Fortune Group.

BTC/USD: Bullish Outlook Persists Amidst Selling PressureHello Everyone,
BTC/USD has been performing as anticipated, continuing to be a strong bullish investment despite significant selling pressure. The daily support level has been resilient, and maintaining a position above the 1D pivot point (PP) will confirm immediate further upside. With this stability, the bullish outlook is expected to persist and thrive in the long term.
TradeWithTheTrend3344

2024-06-06 - a daily price action after hour update - bitcoinGood Evening and I hope you are well.
comment: Bears keep rejecting 71000 and it’s the 4th time bulls touched it. Something has to give, either bulls stop trying or bears defending. My money is on the bears. The bull trend line runs around 68500 and if bears can get below, I am confident that this was the last we have seen from prices above 68000 for a long time. If bulls can break above 72000, they will certainly print a new ath and it also means I’m wrong.
current market cycle: trading range
key levels: 56000 - 74000
bull case: Bulls either use the momentum now to print above 72000 or stop trying. The big bear trend line from the ath is holding somewhat since we are still making lower highs. I can’t find many arguments for the bulls here. They printed a decent double top on the 1h chart and a quadruple top on the daily chart. They kept the 1h bull gap to 69800 open and are 2000 points above the daily ema. Bull trend lines are intact, so they could continue trying to break above 72000.
Invalidation is below 69000.
bear case: They see the many many rejections above 71000 and the double top from today. They need much more selling pressure to close the gap to 69800 and test the lower bull trend line and the daily ema around 69000.
Invalidation is above 72000.
short term: Neutral between 69000 - 72000. Bullish above, bearish below.
medium-long term: down to 40000 (could take 3-6 months). Could also drop to 20000 again but let’s make 40000 first and see how many want to buy there. —unchanged
current swing trade: Short from 70443, sl 71950
trade of the day: Trading range 70000 - 71500. Buy low and sell high at the extremes or don’t trade at all. Selling above 71000 has been profitable since March.

Oh Boy!Well this is it - BTC is right on the edge. Breakout, or failure?
The obvious falling wedge (bullish) that BTC has formed is seen on the chart marked by green lines. A breakout of this should be the final move into new ATH, and confirmation of the bull.
The red line is previous ATH.
Breaking this, and BTC shouldn't look back for many months to come.
It all hangs in the balance at this moment.
Hold on to your hats, one way or the other!


Bitcoin BTC next possible moveThe Bitcoin CRYPTOCAP:BTC is currently forming a bullish flag and has formed an inverted Head & Shoulders pattern in the last few days. Now, I'd like to see how the price breaks through and re-tests the upper channel.
Then, I would consider adding more to my current position.

BTCUSDPair : BTCUSD ( Bitcoin / U.S Dollar )
Description :
Double Top Pattern in Long Time Frame
Break of Structure
RSI - Divergence
Completed " 12345 " Impulsive Waves and " A " Corrective Waves
Symmetrical Triangle as an Corrective Pattern in Short Time Frame

btcusd analysis elliot. Don't forget about stop-loss.
Write in the comments all your questions and instruments analysis of which you want to see.
Friends, push the like button, write a comment, and share with your mates - that would be the best THANK YOU.
P.S. I personally will open entry if the price will show it according to my strategy.
Always make your analysis before a trade

I suspect a breakout is imminent Price has managed to hold this range for the past two weeks. Therefore it can said that there has been enough time for active sellers to sell. Spot flows are bullish. The perp market is not yet overextended.
It seems most probable that equilibrium is higher.

BTCUSD Sellwe are selling, looking at the chart we can see sweep of PDH and ARH we have displacement and IMB along with MSS we enter off the IMB and target 1:2 lets see how it goes.
Bearish engulfing Candle patternLots of info how to trade this, just sharing here incase you missed it - food for thought

Bullish Flag breakout... Inverted H&S Pattern. Or, Bear Flag!!!It appears as though BTC has broken the downward sloping resistance of a bull flag.
Highlighted in Green you can notice an inverted H&S pattern coming to completion.
Also, there is the potential of a break downward from a bearish flag.

Price PredictionJust a little price prediction for a bit of fun. I think there will be continued sideways movement up until we see the classic "sell the news" price action once the halvening is here but we'll eventually start climbing through the summer

Prince Range Questionable I’m short selling BTC since it’s been in Chaos during this 2MO TF. Theres no way of telling where the trend will end up. It’s very volatile.
My new strategy is following smart money buying and selling. For now this is best way to go for me until BTC reestablishes.
I have prices in mind but my main focus is following the buys and sells from the bigger traders.
Soon I’ll have my own software to detect smart money spoofing. Meantime I have my own separate smart money movements with buys and sells.
GREEN RECTANGLE is BTC price range. Reads minimum FWB:65K zone. If I’m told to sell, I’ll update even if it doesn’t hit target.
Once I’m able to detect spoofing, I’ll later have more information based on accurate price range.

BTC fluctuates upward in the short termYesterday, Bitcoin broke through the downward trend line, and then broke through the resistance levels of 68400 and 69000, entering a rapid rise phase. In the short term, it is likely to maintain a fluctuating upward trend. The main trading idea is to buy when the price falls back to the lower resistance range. At present, you can focus on the resistance range of 68800-69250.
Trading suggestion: If the price falls back to the range of 68800-69250, you can buy, with a target of 70000-70500
The above transactions are for reference only, and I will update the market analysis in my guidance group at any time

The journey to 100k per Bitcoin starts today- complimentary analysis to my last one:
- btc displaying a textbook retest of a giant, multi-month bull flag
- 5d volatility at rock bottom supports a +40% move
Fundamentals have never been better:
1. ethereum ETF has been approved and is about to go live soon
2. Trump publicly supporting crypto & crypto holders
3. the chances of a surprise June rate hike are much higher than most people expect
100k - the magical number.


Another cup n handleCup n handle this time on BTC/USD pair.
Is bullrun incoming ?
Stay safe ! Only use money you own !

Eyeballing the Cycle HighThis all seems familiar to me... BTC has popped off from its cycle low and shown us market participants that it's alive, and now its consolidating around the previous cycle high.
This log regression fits quite nicely over Bitcoins steady, exponential and almost linear rise.
It would appear that BTC will break out of the regression channel at around $110.000-$120.000, at which point it would be time to start scaling out - hastily, though not all at once.
This is my strategy, anyway. And, it will have to be adjusted along the way as it'll likely be front-ran by larger and more sophisticated investors, institutions, and governments.

BITCOIN (BTCUSD): Important Decision Ahead ₿
Bitcoin is currently testing a wide daily resistance cluster based on the all-time high.
Because the long-term trend is bullish, there is a great chance that the market
will break it and update the high.
A daily candle close above the underlined structure will confirme the violation.
Bullish rally may continue then.
❤️Please, support my work with like, thank you!❤️
