HOOD: Looking Good For a SwingAnother one setting up for a good trade before earnings.
HOOD has good volatility when it makes its moves making it a good candidate for a swing.
Hood is expected to move up before earnings .
Hood is in buy zone, but still has around 10 4hrs candles of Bearish TIME but with the fractal bottom at
Robinhood Markets, Inc.
No trades
Key facts today
Next report date
—
Report period
—
EPS estimate
—
Revenue estimate
—
2.48 USD
1.41 B USD
2.98 B USD
759.24 M
About Robinhood Markets, Inc.
Sector
Industry
CEO
Vladimir Tenev
Website
Headquarters
Menlo Park
Founded
2013
IPO date
Jul 29, 2021
Identifiers
3
ISIN US7707001027
Robinhood Markets, Inc is a financial services platform, which engages in the provision of retail brokerage and offers trading in U.S. listed stocks and Exchange Traded Funds, related options, and cryptocurrency trading, as well as cash management, which includes debit cards services. The company was founded by Vladimir Tenev and Baiju Prafulkumar Bhatt in 2013 and is headquartered in Menlo Park, CA.
Related stocks

Reversal confirmedHood has broken down from a symmetrical triangle, confirming a reversal. Caution warranted here.

Robinhood (HOOD): A Technical Area Worth Re-EvaluatingRobinhood Markets is one of the most retail-driven platforms in global markets - sitting right at the intersection of trading activity, sentiment, and liquidity.
Love it or hate it, Robinhood remains a direct proxy for retail participation. When activity returns, volumes follow... and price structu

Hood buy zone I have held hood since 8$ and am looking for a potential add zone despite how strong this stock once was. 85$ is an “obvious” zone but markets love to revisit prior swing macro tops even if just for a moment. My buy target is anything under 70$.

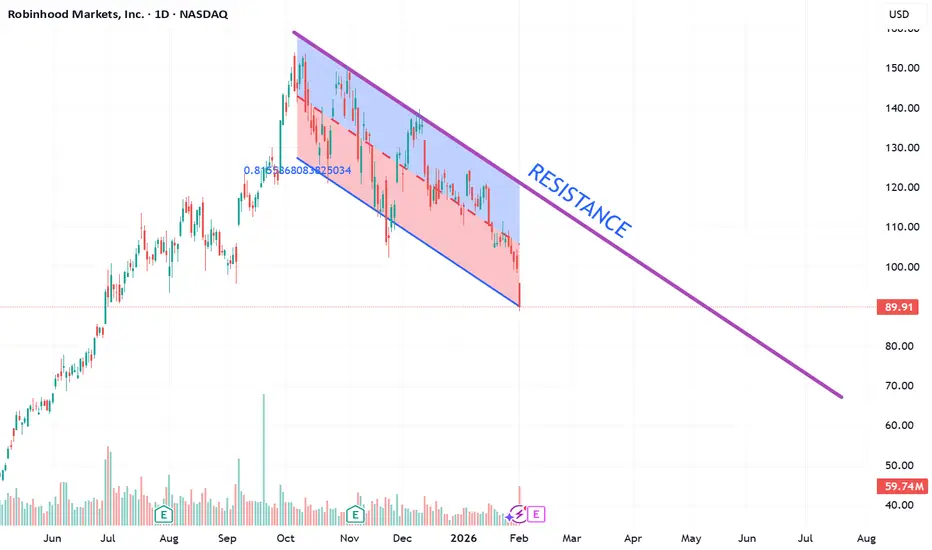
WAIT FOR CONFIRMATIONLet’s stay patient. The trend is still bearish, so the smart move is to wait for price to clearly break and close above the channel resistance. Once that resistance is crossed and confirmed, we’ll all jump in on the opportunity together. No FOMO(fear of missing out) — confirmation first. if all goes
HOOD Weekly Intelligence: Bearish Vector with Defined RiskHOOD QuantSignals V4 Weekly 2026-02-09
HOOD recently closed around $82.82 after a ~14% rebound tied to a crypto recovery.
The stock is heading into a major earnings report (Feb. 10) — often a volatility catalyst.
Expect large directional moves this week.
🎯 Wall Street Outlook
Average 12-month p

HOOD Approaching Key Confluence Zone — Bounce Setup?NASDAQ:HOOD is pulling back into a major area of confluence, aligning with the 100-week moving average and a critical resistance-turned-support zone. This technical region has historically served as a launchpad for bullish reversals and could offer a clean setup for traders watching the long side.

01/18/2026 HOOD longHello traders,
I’m seeing many S&P stocks forming wedge patterns (QQQ is also forming a wedge), and HOOD is one of them. While the exact catalyst for the next market move is unclear, it appears something is cooking, and a directional move may be approaching. HOOD is currently sitting near the low

Top Weekly Trade: HOOD Positioned for a Powerful ReversalHOOD QuantSignals V4 Weekly 2026-02-02
Signal: CALLS
Conviction: HIGH
Alpha Score: 78
Horizon: Weekly (Exp: Feb 7, 2026)
📊 Trade Idea
Strategy: Buy Calls
Contract: $94 CALL
Entry: $1.45 – $1.52
Target 1: $1.81 – $1.90 (+25%)
Target 2: $2.32 – $2.44 (+60%)
Stop Loss: $1.09 – $1.14 (-25%)
👉 R

Where's $HOOD going?Robinhood Markets is an American financial services company headquartered in Menlo Park, California.
Robinhood operates a commission-free broker-dealer application, regulated by FINRA, registered with the U.S. Securities and Exchange Commission (SEC), and is a member of the Securities Investor Prot

See all ideas
Summarizing what the indicators are suggesting.
Neutral
SellBuy
Strong sellStrong buy
Strong sellSellNeutralBuyStrong buy
Neutral
SellBuy
Strong sellStrong buy
Strong sellSellNeutralBuyStrong buy
Neutral
SellBuy
Strong sellStrong buy
Strong sellSellNeutralBuyStrong buy
An aggregate view of professional's ratings.
Neutral
SellBuy
Strong sellStrong buy
Strong sellSellNeutralBuyStrong buy
Neutral
SellBuy
Strong sellStrong buy
Strong sellSellNeutralBuyStrong buy
Neutral
SellBuy
Strong sellStrong buy
Strong sellSellNeutralBuyStrong buy
Displays a symbol's price movements over previous years to identify recurring trends.
Frequently Asked Questions
The current price of HOOD is 86.30 USD — it has decreased by −0.54% in the past 24 hours. Watch Robinhood Markets, Inc. stock price performance more closely on the chart.
Depending on the exchange, the stock ticker may vary. For instance, on NASDAQ exchange Robinhood Markets, Inc. stocks are traded under the ticker HOOD.
HOOD stock has fallen by −4.45% compared to the previous week, the month change is a −26.40% fall, over the last year Robinhood Markets, Inc. has showed a 50.83% increase.
We've gathered analysts' opinions on Robinhood Markets, Inc. future price: according to them, HOOD price has a max estimate of 180.00 USD and a min estimate of 90.00 USD. Watch HOOD chart and read a more detailed Robinhood Markets, Inc. stock forecast: see what analysts think of Robinhood Markets, Inc. and suggest that you do with its stocks.
HOOD reached its all-time high on Oct 6, 2025 with the price of 153.86 USD, and its all-time low was 6.81 USD and was reached on Jun 16, 2022. View more price dynamics on HOOD chart.
See other stocks reaching their highest and lowest prices.
See other stocks reaching their highest and lowest prices.
HOOD stock is 3.53% volatile and has beta coefficient of 2.46. Track Robinhood Markets, Inc. stock price on the chart and check out the list of the most volatile stocks — is Robinhood Markets, Inc. there?
Today Robinhood Markets, Inc. has the market capitalization of 77.83 B, it has decreased by −5.37% over the last week.
Yes, you can track Robinhood Markets, Inc. financials in yearly and quarterly reports right on TradingView.
Robinhood Markets, Inc. is going to release the next earnings report on Feb 10, 2026. Keep track of upcoming events with our Earnings Calendar.
HOOD earnings for the last quarter are 0.61 USD per share, whereas the estimation was 0.54 USD resulting in a 13.36% surprise. The estimated earnings for the next quarter are 0.63 USD per share. See more details about Robinhood Markets, Inc. earnings.
Robinhood Markets, Inc. revenue for the last quarter amounts to 1.27 B USD, despite the estimated figure of 1.21 B USD. In the next quarter, revenue is expected to reach 1.35 B USD.
HOOD net income for the last quarter is 556.00 M USD, while the quarter before that showed 386.00 M USD of net income which accounts for 44.04% change. Track more Robinhood Markets, Inc. financial stats to get the full picture.
No, HOOD doesn't pay any dividends to its shareholders. But don't worry, we've prepared a list of high-dividend stocks for you.
As of Feb 10, 2026, the company has 2.3 K employees. See our rating of the largest employees — is Robinhood Markets, Inc. on this list?
EBITDA measures a company's operating performance, its growth signifies an improvement in the efficiency of a company. Robinhood Markets, Inc. EBITDA is 2.11 B USD, and current EBITDA margin is 38.82%. See more stats in Robinhood Markets, Inc. financial statements.
Like other stocks, HOOD shares are traded on stock exchanges, e.g. Nasdaq, Nyse, Euronext, and the easiest way to buy them is through an online stock broker. To do this, you need to open an account and follow a broker's procedures, then start trading. You can trade Robinhood Markets, Inc. stock right from TradingView charts — choose your broker and connect to your account.
Investing in stocks requires a comprehensive research: you should carefully study all the available data, e.g. company's financials, related news, and its technical analysis. So Robinhood Markets, Inc. technincal analysis shows the sell today, and its 1 week rating is sell. Since market conditions are prone to changes, it's worth looking a bit further into the future — according to the 1 month rating Robinhood Markets, Inc. stock shows the buy signal. See more of Robinhood Markets, Inc. technicals for a more comprehensive analysis.
If you're still not sure, try looking for inspiration in our curated watchlists.
If you're still not sure, try looking for inspiration in our curated watchlists.