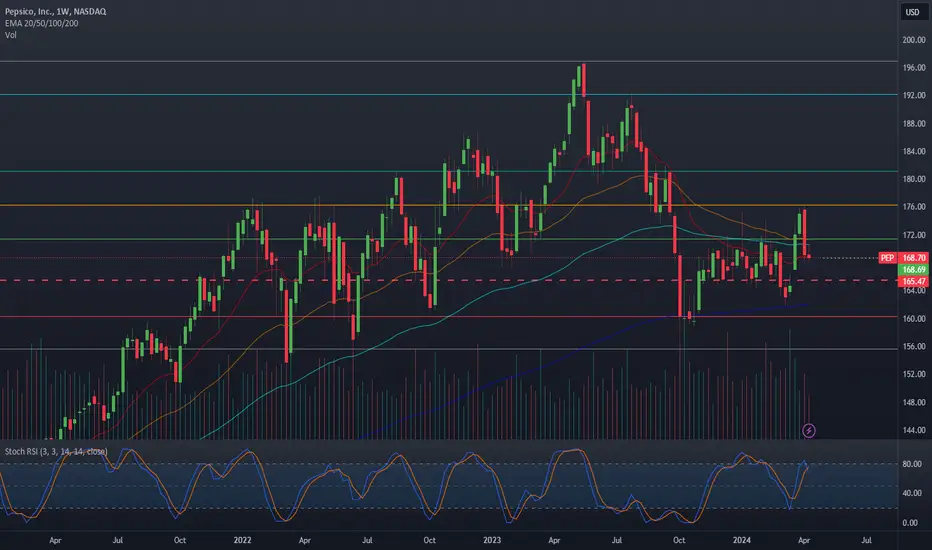
PEP — Two Years of Compression, Base Forming Above Key SupportBIAS: Long (weekly / position timeframe think months)
THE SETUP:
PepsiCo has spent 2+ years grinding down from the ~$185 highs into a tightening range. Price is now sitting on a well-tested support shelf at $139.56 and weekly RSI is lifting off oversold. This is a base forming not a confirmed break
Compare with PepsiCo, Inc.
Key facts today
Rep. Mike Kelly reported selling $15,000–$50,000 of PepsiCo (PEP) shares on July 17, 2024; filing notes his spouse participated in the transactions. 1
7.64 USD
8.24 B USD
93.92 B USD
1.36 B
Next report date
—
Report period
—
EPS estimate
—
Revenue estimate
—
Details
Sector
Industry
CEO
Ramon Luis Laguarta
Website
Headquarters
Purchase
Founded
1965
IPO date
Dec 18, 1919
ISIN
US7134481081
CUSIP
713448108
FIGI
BBG000DH7JK6
Identifiers
ISIN US7134481081
PepsiCo, Inc. is a global food and beverage company. The Company's portfolio of brands includes Frito-Lay, Gatorade, Pepsi-Cola, Quaker and Tropicana. The Company operates through six segments: Frito-Lay North America (FLNA), Quaker Foods North America (QFNA), North America Beverages (NAB), Latin America, Europe Sub-Saharan Africa (ESSA), and Asia, Middle East and North Africa (AMENA). The FLNA segment includes its branded food and snack businesses in the United States and Canada. The QFNA segment includes its cereal, rice, pasta and other branded food businesses in the United States and Canada. The NAB segment includes its beverage businesses in the United States and Canada. The Latin America segment includes its beverage, food and snack businesses in Latin America. The ESSA segment includes its beverage, food and snack businesses in Europe and Sub-Saharan Africa. The AMENA segment includes its beverage, food and snack businesses in Asia, Middle East and North Africa.
Pepsi to push back to 160Pepsi has tested and reclaimed the 38.2% fibonacci retracement.
I am looking for the recent swing lows to hold for a push back to the 23.6% retracement. POC will be the big level to watch when and if we get there. A rejection at the POC and I will cut this trade short. A strong close through that l
$PEP: Support Holding, Turnaround Catalyst Ahead, $166 TargetSetup:
PEP is holding the $138-140 zone that's acted as support since 2022, this is the 4th+ test of the level. Currently at $138.61, it rejected off ~$168 highs earlier this year and rolled back down to the floor. Reclaiming resistance opens the door back toward $166. Looking for continuation off
PEP: Nearing Bottom of Channel With Two Buy ZonesPEP remains inside a broad descending channel while daily RSI forms bullish divergence, suggesting downside momentum may be weakening. Stochastics are oversold. *Note; the RSI looks weaker on the 4HR so this is time frame to watch for the RSI to confirm divergence. I expect that it may not hold.
If
Why PepsiCo Shares Fell After a Strong Revenue QuarterPepsiCo reported solid second quarter results, but investors focused on signs that consumers are pulling back. Revenue climbed 6% year over year to $24.2 billion, beating expectations by $230 million. Adjusted EPS came in at $2.20, just one cent below estimates. Organic revenue grew 2.4%, helped by
PepsiCo Is Testing a 30-Year Support ChannelNASDAQ:PEP PepsiCo has spent decades moving inside one of the cleaner long-term channels on the chart. On a logarithmic monthly view, the structure stretches back to roughly 1995, giving traders a rare look at more than 30 years of repeated support, resistance, and trend continuation.
That makes t
PEP: Post-Earnings Rally Could Send Shares to $158Pepsi (PEP) shares eased slightly ahead of Thursday's opening bell after the beverage maker posted mixed second quarter results as healthy sales in its international snacks and drinks business helped offset weaker demand across its North American divisions.
Taking a closer look at Pepsi's chart, th
PepsiCo: Nearing Key Target ZoneAt the end of June, PepsiCo shares pulled back to the $135 level, nearly touching the upper boundary of our green Target Zone ($132.55–$121.20). Since then, the price has rebounded about 7%, but we still expect PEP to face renewed selling pressure in the near term. Our primary view is that Pepsi sha
Deep dive analysis on PEP!NASDAQ:PEP
This video is dedicated to one of my subscribers who requested this chart analysis. I hope this helps you and really anyone out there who is interested in PEP.
In my humble opinion I think PEP is a buy! especially if it get to those lower levels and if it gets to the gap fill defini
See all ideas
Summarizing what the indicators are suggesting.
Neutral
SellBuy
Strong sellStrong buy
Strong sellSellNeutralBuyStrong buy
Neutral
SellBuy
Strong sellStrong buy
Strong sellSellNeutralBuyStrong buy
Neutral
SellBuy
Strong sellStrong buy
Strong sellSellNeutralBuyStrong buy
An aggregate view of professional's ratings.
Neutral
SellBuy
Strong sellStrong buy
Strong sellSellNeutralBuyStrong buy
Neutral
SellBuy
Strong sellStrong buy
Strong sellSellNeutralBuyStrong buy
Neutral
SellBuy
Strong sellStrong buy
Strong sellSellNeutralBuyStrong buy
Displays a symbol's price movements over previous years to identify recurring trends.
Maturity dateMar 19, 2050
Coupon3.63% (Fixed)
Maturity dateOct 21, 2051
Coupon2.75% (Fixed)
Maturity dateOct 6, 2046
Coupon3.45% (Fixed)
Maturity dateJul 18, 2052
Coupon4.20% (Fixed)
Maturity dateOct 15, 2049
Coupon2.88% (Fixed)
Maturity dateMay 2, 2047
Coupon4.00% (Fixed)
Maturity dateApr 14, 2046
Coupon4.45% (Fixed)
Maturity dateMar 19, 2060
Coupon3.88% (Fixed)
Maturity dateFeb 15, 2053
Coupon4.65% (Fixed)
Maturity dateJul 29, 2049
Coupon3.38% (Fixed)
Maturity dateJul 17, 2054
Coupon5.25% (Fixed)
See all PEP bonds
Frequently asked questions
The current price of PEP is 140.79 USD — it has increased by 1.38% in the past 24 hours. Watch PepsiCo, Inc. stock price performance more closely on the chart.
Depending on the exchange, the stock ticker may vary. For instance, on NASDAQ exchange PepsiCo, Inc. stocks are traded under the ticker PEP.
PEP stock has risen by 0.38% compared to the previous week, the month change is a 1.71% rise, over the last year PepsiCo, Inc. has showed a −5.53% decrease.
We've gathered analysts' opinions on PepsiCo, Inc. future price: according to them, PEP price has a max estimate of 183.00 USD and a min estimate of 124.00 USD. Watch PEP chart and read a more detailed PepsiCo, Inc. stock forecast: see what analysts think of PepsiCo, Inc. and suggest that you do with its stocks.
PEP stock is 0.82% volatile and has beta coefficient of 0.08. Track PepsiCo, Inc. stock price on the chart and check out the list of the most volatile stocks — is PepsiCo, Inc. there?
Today PepsiCo, Inc. has the market capitalization of 191.93 B, it has increased by 5.32% over the last week.
Yes, you can track PepsiCo, Inc. financials in yearly and quarterly reports right on TradingView.
PepsiCo, Inc. is going to release the next earnings report on Oct 13, 2026. Keep track of upcoming events with our Earnings Calendar.
PEP earnings for the last quarter are 2.20 USD per share, whereas the estimation was 2.19 USD resulting in a 0.65% surprise. The estimated earnings for the next quarter are 2.30 USD per share. See more details about PepsiCo, Inc. earnings.
PepsiCo, Inc. revenue for the last quarter amounts to 24.18 B USD, despite the estimated figure of 23.95 B USD. In the next quarter, revenue is expected to reach 25.00 B USD.
PEP net income for the last quarter is 2.98 B USD, while the quarter before that showed 2.33 B USD of net income which accounts for 0.00% change. Track more PepsiCo, Inc. financial stats to get the full picture.
Yes, PEP dividends are paid quarterly. The last dividend per share was 1.48 USD. As of today, Dividend Yield (TTM)% is 4.09%. Tracking PepsiCo, Inc. dividends might help you take more informed decisions.
PepsiCo, Inc. dividend yield was 3.91% in 2025, and payout ratio reached 93.68%. The year before the numbers were 3.49% and 76.68% correspondingly. See high-dividend stocks and find more opportunities for your portfolio.
As of Aug 15, 2026, the company has 306 K employees. See our rating of the largest employees — is PepsiCo, Inc. on this list?
EBITDA measures a company's operating performance, its growth signifies an improvement in the efficiency of a company. PepsiCo, Inc. EBITDA is 19.43 B USD, and current EBITDA margin is 20.22%. See more stats in PepsiCo, Inc. financial statements.
Like other stocks, PEP shares are traded on stock exchanges, e.g. Nasdaq, Nyse, Euronext, and the easiest way to buy them is through an online stock broker. To do this, you need to open an account and follow a broker's procedures, then start trading. You can trade PepsiCo, Inc. stock right from TradingView charts — choose your broker and connect to your account.
Investing in stocks requires a comprehensive research: you should carefully study all the available data, e.g. company's financials, related news, and its technical analysis. So PepsiCo, Inc. technincal analysis shows the buy rating today, and its 1 week rating is sell. Since market conditions are prone to changes, it's worth looking a bit further into the future — according to the 1 month rating PepsiCo, Inc. stock shows the sell signal. See more of PepsiCo, Inc. technicals for a more comprehensive analysis.