natural gas @315gas break major resistance in next(nov) contract going to reach 312 to 315 in upcoming days
NGF2017 trade ideas

#NATURALGAS LONG TRADE IDEA SETUPGreetings Folks,
today i have prepared a setup of NATURAL GAS on MCX
the analysis is as follows
- the price is looking for a minor reversal
- currently trading at a very important zone
- wait for a retest for entry
dont play with fire, always use a predefined stoploss

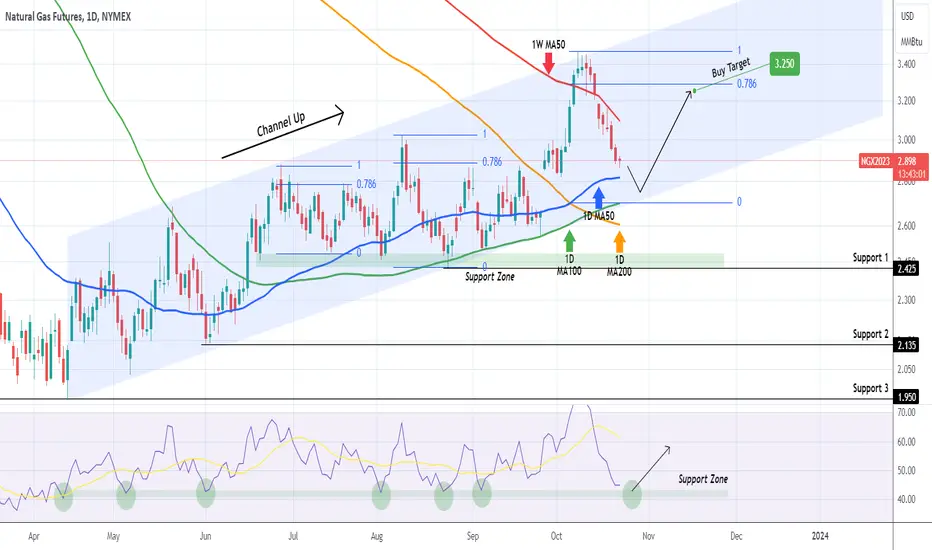
NATURAL GAS Ready to buy at the bottom of the Channel Up?Natural Gas (NG1!) is trading within a logarithmic Channel Up pattern since the April 14 Low. The current bearish leg is one step before testing the 1D MA50 (blue trend-line) but the bottom is located just below the 1D MA100 (green trend-line). That trend-line has priced the last three Higher Lows (September 26, September 06, August 24), so we are ready to buy there and target the 0.786 Fibonacci at 3.250, which has been a standard rebound target since July. The most optimal buy signal though since April 13 is when the 1D RSI enters its Support Zone.
-------------------------------------------------------------------------------
** Please LIKE 👍, FOLLOW ✅, SHARE 🙌 and COMMENT ✍ if you enjoy this idea! Also share your ideas and charts in the comments section below! This is best way to keep it relevant, support us, keep the content here free and allow the idea to reach as many people as possible. **
-------------------------------------------------------------------------------
💸💸💸💸💸💸
👇 👇 👇 👇 👇 👇
NatGas: Dived in 🤿 🌊The price of NatGas has now reached the turquoise target zone between $2.98 and $2.77. Here we expect a turning point with the low of the turquoise wave (ii), ideally at the 78.60% retracement of the zone. From there, the price should move higher in large steps until it completes the orange wave (iii) at $4.60.


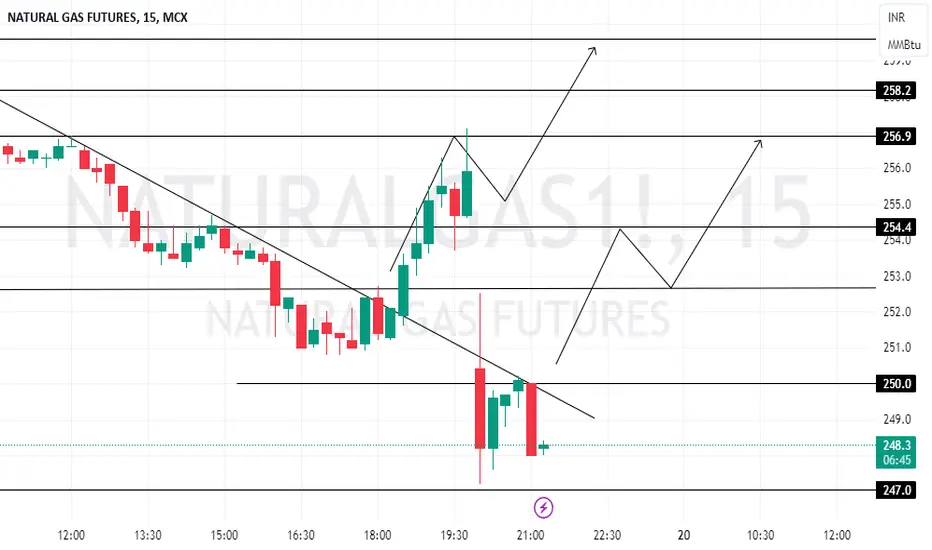
Natural GasNatural Gas Intraday trade
Long : above 251
Sl : 247
Target : 254 / 257
========================
Short : below 247
Sl : 250
Target : 242
Enjoy !
Natural GasNatural Gas Intraday
Long : above 253
Sl : 250
Target : 257 / 260
==================
Short : Below 250
Enjoy !

Natural GasNatural Gas (Intraday View Only)
Short : 260
Sl : 263
Target : 250 / 247
===========================
Long : Sustain above 262
Enjoy !

TTF Gas - Potential ABCSeasonal European NatGas is week, but typically in August the rebound starts regarding due to the hedging of winter demand. The chart already shows a potential pattern, i.e. a potential ABC embedded in a channel. If this channel breaks, we might see an increase to 45 €/MWh.

Natural Gas Trend Continuation LONGNot a market we trade super often, but there has obviously been a LOT of opportunity in natural gas as of late. After a long period of accumulation, NG has finally broken out to the upside. We are looking for potential trend continuation longs. Ideally, we would like to enter this trade around the ~3.00 level (roughly coincides with Anchored VWAP + support/resistance “flip zone”), but it may be a bit before NG trades back to those prices (if it does). However, shorter-term/more aggressive entries exist via demand zones circa 3.2. We’ve formed new/”fresh” 60-minute supply @ 3.346-3.380, so that is an upside target. One should drill down via smaller timeframes (30/20/15-minute), though, to see what additional supply zones form between ~3.2 and 3.346 – it’s likely other sell levels will exist within expanded range candlesticks formed earlier this morning (EST). Smaller timeframe supply zones + any resistance levels should serve as profit targets for longs; if you enter a trade with multiple contracts, you can always hold a runner and look for new highs if upside momentum is strong. Finally, keep in mind seasonality. We are doing a more thorough analysis here, but NG tends to catch a tailwind during colder months (vs. summer)... We’ll keep an eye on this market and will provide updates accordingly. As is always the case with trading, our approach/thesis could change as price action unfolds, so use your discretion when evaluating this idea. Questions/comments welcome!
Jon @ LionHart Trading

Natural Gas- 4HNG is moving in a parallel range, tried to break, but looks like it was a fake breakout. Again inside the channel, can sell and aim for 2.771 levels, as also that region has a gap which needs to be filled.

NATGAS BULLS WILL DOMINATE THE MARKET|LONG
Hello,Friends!
The BB lower band is nearby so NATGAS is in the oversold territory. Thus, despite the downtrend on the 1W timeframe I think that we will see a bullish reaction from the support line below and a move up towards the target at around 3.457.
✅LIKE AND COMMENT MY IDEAS✅

A Traders' Weekly Playbook - energy markets to direct sentimentWe look at the scheduled economic data and US earnings this week and question if given the fluid news flow from the Middle East, these events move the dial or if geopolitics consumes the full attention and direct sentiment.
We saw a rush to hedge portfolios on Friday ahead of a darkening picture emerging in the Middle East. The situation is dynamic and it's too early to say if the hedges placed on Friday are unwarranted, but there have been pockets of positive news flow – for example, US Secretary of State Blinken saying aid will get to Gaza via the Egyptian border, and Israel opening water supply to Southern Gaza, with over 600k Gazans moving south.
A call between US National Security Advisor Jake Sullivan and Iranian officials is a development, with the US warning not to increase aggression. As Israel's ground offensive pushes into Gaza, risk and energy markets will look for headlines and actions from Iranian officials who have stated they have a duty to come to the aid of the Palestinians.
Watching crude and Nat Gas
The energy markets are the first derivative to drive broad market sentiment this week, with crude and Nat Gas leading investors to trade volatility (options), as well as classic hedges such as gold and Treasuries. Amid a backdrop of ‘higher for longer’, and the US CPI inflation gaining 0.4% in September, higher energy prices could deliver a one-way punch to sentiment.
Given market participants are generally poor at pricing risk around geopolitical developments, it's no wonder most have looked to mitigate drawdown - but at this stage, while there is a growing wall of worry to potentially climb, the probability is traders will use strength in risky assets to reduce exposures.
The probability of supply disruptions is one of the key aspects here – last week we saw the closure of Chevron’s Tamar gas field in Israel – the focus has been rerouting that gas from the Leviathan gas fields in the North of Israel – if the market feels this gas field could be impacted then could see a spike in EU NG. Many energy experts see the risk of a supply event here as fairly low, but should developments escalate on various fronts, then the market will increase the possibility of a disruption.
The bear case for risk, given the potential for a significant rally in EU NG and crude, would be where the market increases the probability of Iran curtailing the movement of LNG through the Straits of Hormuz, where notably Qatar LNG supply (20% of the global LNG market) would be impacted. Again, this seems a low probability at this stage, but that will depend on Iran’s ongoing involvement and any new sanctions placed on them.
Downside risk to the EUR
If EU NG spikes higher in the near term, then talk of a renewed energy crisis in Europe will resurface and the EURUSD could be headed to parity. As said, this probability is a lower risk right now, but when considering the risks, this is the market concern that will be monitored.
While sentiment will move around on each headline, we revisit the hedging flows seen on Friday, as traders de-risked ahead of potential gapping risk – It’s too hard to make a call on whether these hedges are partly unwound in Asia.
Where did we see the hedging flows?
• Gold rallied 3.4% on Friday - a 3-sigma move and the second biggest day since 2020. A massive 299k gold futures contracts traded, the highest since May. XAUUSD 1-month implied volatility has pushed to 15% and 1-week call volatility has increased to a 1.75 vol premium to puts – the most since March.
• The XAUUSD price closed at a 2.8% premium to the 5-day moving average, which shows the sheer pace of the intraday rally, with limited intraday mean reversion – sellers just stood aside.
• Brent crude closed 5% higher with our Brent price closing over $91 and eyeing a move back to the recent highs of $96 – WTI Crude futures saw the curve lift and go further into backwardation – this typically means the market sees a higher probability of a supply shock.
• In equities, the VIX traded to a high of 20.78%, settling at 19.3% (+2.6 vols on the day) – a VIX index at 19.3% implies daily % changes in the S&P500 of 1.2% and 2.7% on the week.
• S&P 1-month put implied vol now trades at a 5.46 vol premium to 1-month calls – This volatility ‘Skew’ is now the most bearish since May – traders are ramping up the demand for downside puts to protect in case of drawdown.
• Market breadth was ok with 46% of S&P500 stocks closed higher – there was no blanket selling, but a rotation from tech and consumer names into energy and defensive sectors - staples, utilities, and healthcare.
• While we saw some buying in petrocurrencies (NOK & CAD) but traders played defense buying into the CHF & JPY – short NZDCHF was the play of the day (-1.4%), with GBPCHF breaking the long-run range lows.
• US Treasuries rallied with 10’s closing -8bp and 30’s -10bp.
Marquee event risks for the week ahead:
• NZ Q3 CPI (17 Oct 08:45 AEDT) – the market consensus is for 1.9% QoQ / 5.9% YoY (from 6%) – NZDCHF was the biggest percentage mover on Friday following the risk aversion flows – will the sellers follow through?
• UK jobless claims/wage data (17 Oct 17:00 AEDT) – the consensus for wages sits at 7.8% (unchanged) – UK swaps place a 29% chance of a hike from the BoE at the 2 Nov BoE meeting, will the wage data influence that pricing? GBPCHF trades the weakest levels since Oct 2022 and looks likely to be sold on rallies
• US retail sales (17 Oct 23:30 AEDT) – the advanced read is expected at 0.3% mom and the ‘control group’ element at -0.1%. The retail numbers could influence market sentiment, especially if we see a big miss to expectations, with USDJPY and USDCHF the pairs most sensitive to a weaker outcome. Gold could find further buyers on a downside surprise.
• Canada CPI (23:30 AEDT) – headline CPI is expected at 4% yoy, with core CPI eyed at 4% yoy
• Fed chair Jay Powell speaks at the Economic Club of NY (20 Oct 03:00 AEDT) – the highlight of the week. Expect Powell to focus on the view that moves in the bond market are mitigating the need for the Fed to hike further.
• China Q3 GDP (18 Oct 13:00 AEDT) – consensus is 4.5% yoy (from 6.3%) – likely a trough in China’s GDP, with better levels ahead.
• China Industrial production, fixed asset investment, retail sales (18 Oct 13:00 AEDT)
• UK Sept CPI (18 Oct 17:00 AEDT) – the consensus for headline CPI is 6.6% yoy (from 6.7%) / core CPI at 6% yoy (6.2%) – a risk to manage for traders holding GBP exposures
• EU CPI (18 Oct 20:00 AEDT) – no change expected in the revision, with headline CPI eyed at 4.3% /core CPI at 4.5%. Should be a non-event for the EUR and EU equities.
• Australia employment report (19 Oct 11:30 AEDT) – the consensus estimate is for 20k jobs to have been created in September and the U/E rate unchanged at 3.7% - expect the impact from Aussie jobs to be short-lived – preference to work sell limits in AUDUSD on the day and sell into strength.
• China new homes prices (19 Oct 12:30 AEDT)
• China 1 & 5-year Prime Rate (20 Oct 12:15 AEDT) – the consensus is no change with the 1yr rate to stay at 5.2% & the 5yr rate at 3.45%
US Earnings (with the implied move on earnings) – Goldman Sachs (3.7%), Bank of America (4.6%), Tesla (5.2%), Netflix (7.5%)
Central bank speeches:
BoE – Huw Pill, Sam Woods, Swati Dhingra
ECB – Villeroy, Knot, Centeno, Guindos, Holzmann
Fed – see schedule below

NATGAS: Growth & Bullish Forecast
The price of NATGAS will most likely increase soon enough, due to the demand beginning to exceed supply which we can see by looking at the chart of the pair.
❤️ Please, support our work with like & comment! ❤️

NATGAS Sellers In Panic! BUY!
My dear subscribers,
My technical analysis for NATGAS is below:
The price is coiling around a solid key level - 3.208
Bias - Bullish
Technical Indicators: Pivot Points Low anticipates a potential price reversal.
Super trend shows a clear buy, giving a perfect indicators' convergence.
Goal - 3.319
About Used Indicators:
By the very nature of the supertrend indicator, it offers firm support and resistance levels for traders to enter and exit trades. Additionally, it also provides signals for setting stop losses
———————————
WISH YOU ALL LUCK

NaturalGasNaturalGas Chart Analysis 13/10/23
Long : Closing above 291 lvl. / 254
Sl : 268 (291 long k liye) / 254
Target : 339
============================
Short : below 268 lvl.
Sl : 280
Target : 255
Enjoy !
Note : If you look at the weekly chart of Natural Gas you will see a Doji candle spinning top. This is a positional view or where I have written intraday in my analysis that you can go long/short when the level becomes active on the same day. Do not mix both the views.


Long November Natural Gas Market, Sell Stop Loss 3.12; Target 3.Energy market technical indicators show move higher over short term 2 days - 2 weeks.

long NGISRAEL CLOSES AN IMPORTANT GAS FIELD NAMED "TAMAR" FOR SECURITY REASONS.
Israel has ordered the closure of a significant gas field managed by Chevron Corporation for security reasons.
Gas extractions carried out by Israel over the past two decades have transformed the country's economy and turned it into an exporter of this fuel. A portion of the supplies is destined for Egypt, which, in turn, transports it to Europe. This activity had become particularly active following the ban on gas supplies from Russia.
⚡️The shutdown of Tamar could lead to a reduction in supplies or even delays, especially after Egypt had planned to resume LNG exports to Europe this month in anticipation of the European winter. Gas prices in Europe have risen by 11% upon hearing this news.
In August, Israel had announced plans to export more gas from Tamar to Egypt as part of strengthening ties with its neighbor. The uncertainty surrounding these plans is due to increased tensions in the Middle East.
The offshore Tamar field is located 14.9 miles (24 kilometers) west of Ashkelon, north of the Gaza Strip, as reported by Bloomberg. According to Chevron's website, gas is produced from six wells, with each well producing approximately 7.1-8.5 million cubic meters per day.

NATURAL GAS Sell signal on overbought Channel Up despite the GolNatural Gas is trading inside a Channel Up since the April 14th Low.
Despite forming a Golden Cross on the (1d) time frame last Thursday, we have a short term sell signal as the price reached the top of the Channel Up.
Trading Plan:
1. Sell on the current market price.
Targets:
1. 2.950 (expected contact with the MA50 1d).
Tips:
1. The RSI (1d) is highly overbought, the highest since May 4th 2022, making the sell signal stronger.
Please like, follow and comment!!

💡 Don't miss the great Buy opportunity in NG1!(Gas)Hi everyone
It seems that we have to wait for an increase in gas prices in the coming months. If there are no special problems, I think we can predict the price of 3.6 dollars for gas.
Do you agree with my opinion? Please support me with likes and comments.

Natural Gas - Elliott Wave CountNatural Gas - Elliott Wave Count
Natural Gas - On the 1hr chart, NG displays a clear impulse Wave formation, indicating that the market is likely to continue the bull run to the 300 range after the minor correction(may drop to the 260 range for the short term) and then we can expect significant correction toward the 180 range.
Please note that this information is for educational purposes only, and it is crucial to trade with caution.
CAPITALCOM:NATURALGAS FOREXCOM:NATURALGASCFD MCX:NATURALGAS1! PEPPERSTONE:NATGAS NYMEX:NG1! MOEX:NG1! VANTAGE:NG

Natural Gas - Elliott Wave CountNatural Gas - Elliott Wave Count
Natural Gas - On the Daily charts, NG displays a clear impulse Wave formation, indicating that the market is likely to continue the bull run to the 300 range after the minor correction(may drop to the 250 range for the short term) and then we can expect significant correction toward the 162 range.
Please note that this information is for educational purposes only, and it is crucial to trade with caution.
CAPITALCOM:NATURALGAS MCX:NATURALGAS1! PEPPERSTONE:NATGAS NYMEX:NG1! MOEX:NG1!
