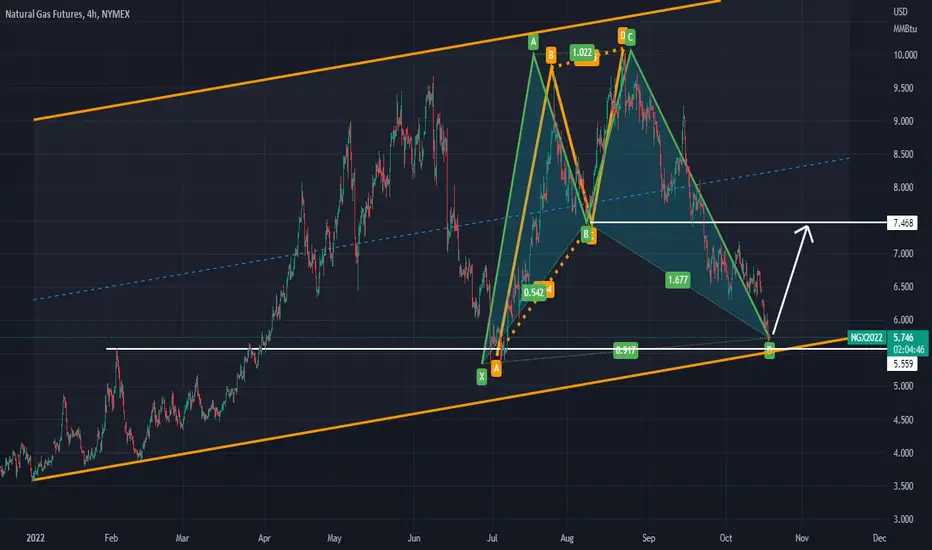
looking for bullish cypher set upPrevious Resistances of $5.559 acting as support for this current D leg.. I initially spotted the ABCD pattern in orange, then I looked for the Bullish Cypher on D leg to kick off. The AD Will confirm
QG1! trade ideas
Natural Gas / NG - It's Officially a Bear. Now, Hold My BeerThis post is a continuation of a previous post, which is based on a longer-term analysis:
Natural Gas / NG - What, Truly, Is a Bull?
With Wednesday-Friday and Monday morning's long-awaited dump into the fabled double bottom around $7.4, natural gas can only be considered to have formally shifted into a bearish market structure, based on both the 4H and Daily candles.
Note that the dump also breached range equilibrium.
What this means, is that it's finally time to look for a 45-day short play on natural gas. Remember, Freeport is supposed to re-open for export to Europe in mid-November, so in principle you'd want to see the downside manipulation occur before then.
However, all this time, big firms have been shipping U.S. natural gas via boat to Europe, and making more than $100 million a shipment in the process . Demand has been so enormous that there aren't enough ships on the planet available to meet it.
So it's not that U.S. Henry Hub pricing hasn't reflected the demand problem caused by Europe shooting itself in the knees trying to spite Putin and Russia so it can fit in with cool kids in the Globalist Bloc. It has.
It's just that the reality is, no matter the news and how it's framed, an energy crisis is coming to North America too.
You just won't see it until inflation starts to dip. Energy prices have to come down for inflation to dip. Once inflation dips, it will rip again, because it hasn't topped yet. Anyone who says inflation has peaked obviously can't read The Diagram, and nobody who is unable to read The Diagram is worthy of being a Doctor.
Regarding price action, once something as turbulent as natural gas dumps, and dumps a lot, and takes out key pivots, you have to be careful. At present the market makers are still employing these patterns where they seek and destroy to the downside and then quickly seek and destroy the upside.
It's very hard to catch a truly trending market at the moment, and so you have to employ a surgical strike style of trading and positioning rather than trying to get long or get short and rack up the Sklansky Bucks comfortably.
For example, the stock indexes look like they're going to bounce, and probably hard, before the next big leg down, regardless of what comes out of Wednesday's FOMC:
SPX500 / ES - It's Still a Bull. Now, Good Luck Riding It
With natural gas, what I'm really looking for here to position puts for November is a bounce into the $8.9 range. The problem is, the natural gas market makers are not so polite. They don't want you along for their ride. It's their ride, and if you're good enough to figure it out, you can make money. But if you can't, they will buck you off and you can watch from the sidelines.
They're a lot like angry cowboys, and so there is a possibility that is far from negligible that a number like $9.6 prints again before we see the next move down.
Or at least a number that starts with $9.
Regardless, in my opinion, once this bear is finished growling and knocking over trees, we will actually begin to see trending markets again. They won't trend for all that long, but you won't get bounces this time. It'll just landslide or gap down to where it wants to go and collect all the badly positioned longs or the longs who somehow never took profit during a run to $10.
WTI Oil, likewise, is in the same boat.
WTI Crude / CL - An Intervention: Saving Blind Bulls
Although its price pattern is more notable in that it once again traded back to the $81 gap and bounced again. If it runs the $91 double top it left behind and keeps going up, it might just be a bull run again. But if it just crushes $91 and starts to fall, you can surely expect numbers like $69 and $50 are en route, no matter what the fundamentals say about global demand.
What you're ultimately looking at with the positioning of the markets, whether it be copper, soybeans, stocks, is you're looking at first some bouncing and then what is likely a market-wide sell off with some days of panic that is simultaneously subdued and overexaggerated.
All of which is designed to have you sell low and then buy back higher with half your account left intact.
Consider that last week's CPI dump took 200 points from the SPX in a few hours, but only raised the VIX by like 3 points. VIX 28 is now a ceiling. VIX 40-42 will be where you find the bottoms. VIX 72 will come when the markets truly start to head to the downside.
After the global avalanche is finished, you'll likely see the Nasdaq be extremely strong for a few months. SPX will be okay, but will be drug down by energy companies, which won't do particularly well because they'll be drug down by natural gas and WTI accumulating at low prices. Dow will probably be better than SPX but worse than Nasdaq on account of its defense contractors likewise accumulating at low prices.
Once retail is done gorging themselves stupid on $30 SNAP and $45 BBBY and $198 AAPL, reality will unfold. Stocks will crash, hard.
WTI and Natural Gas and other commodities (Except for silver and gold. Seriously. Quit being a moonboy on ancap stuff. It'll rot your teeth.) will make major new highs and energy companies and defense contractors will become the safe haven in the markets.
When those days unfold, you can expect major geopolitical turbulence, which can include as much as the collapse of the Chinese Communist Party. You can also see significant natural and manmade disasters unfold. It won't be a pleasant time. But you should know that what unfolds will appear chaotic but actually be orderly.
Everything unfolding in the world is orderly and well arranged. This world will not be destroyed, although there will be significant hardship for many regions, and few will find the outcome comfortable.
But for now, you can focus on trying to make money. You have the difficult task of trying to find a time to short natural gas inside of a 15% possible range. You can short $8.9, but they really might take that $9.3 pivot. If you wait for the $9.3 pivot, you might not get filled and miss the move.
This kind of move back up is also designed to dump the ETFs, many of which trade on 2x leverage (10% natural gas move = 20% ETF dump), so big pockets can get fat long for the real dump.
It's very annoying. They're really very annoying about how they do things. It's a constant gut check and a series of difficult and suboptimal circumstances, because time is an excellent weapon and they use it very well.
You should know that all the decisions you face when trading and all the loss and gain you come across are actually opportunities to cultivate your mind and your heart. They're chances to improve.
Every thought and feeling you have while doing this is you forging yourself like quicksilver being refined inside of a crucible powered by burning hydrogen.
Everything depends on how you improve your heart and employ your rationality. Fear and greed are your greatest enemies.

Natural Gas will rally, at least a little bit! 5-15% min.Economic Reasons:
- Natural Gas Nord Stream Sabotage
- Hurricane heading to US
Reasons for a trend reversal:
- Price is heading for a macro uptrend
- Key zone of support and liquidity
- 0.786 retracement from Aug. highs and Sept. lows ($6.33)
- Almost over sold on RSI and MACD on the daily chart. (it is over sold on lower timeframes)
- Bullish divergence on the RSI and MACD for the 4 hr. chart.
Take Profits:
$7.12 (Highest Probability) -- 12% profit
$7.45 -- 17.6% Profit
$8.11 -- 27.6% Profit
$8.60 (Most Likely Top) -- 36% Profit
$9.22 -- 46% Profit
Bearish after rally:
- Completion of the right shoulder of a head and shoulders pattern.
- Break neckline and return to $3.5-4.5's

Natural Gas Futures ( QG1! ), H4 Potential for Bearish MomentumType: Bearish Momentum
Resistance: 600.5
Pivot: 516.5
Support: 327.8
Preferred Case: On H4, as the price moving below ichimoku cloud and descending channel , we have a bearish bias that the price may drop from the pivot at 516.5. which is in line with the overlap resistance to the 1st support at 327.8, where the 127.2% fibonacci extension is.
Alternative scenario: Alternatively, the price may rise to the 1st resistance at 600.5, which is in line with the 38.2% fibonacci retracement .
Fundamentals: There are no major news.

Natural Gas - Head and Shoulder target 5.325Head and Should Target 5.325 also coincides with July lows

Natural Gas D1The situation that has developed in the energy sector is rather complicated but not critical! Since the beginning of full-scale hostilities in Ukraine, natural gas prices have soared by almost 200%, and this is taking into account that the heating season has almost come to an end. The issue of gas supplies to Europe is one of the key issues in this matter (in my opinion). At this point in time, the heating season begins. During which gas consumption increases significantly. Although European countries have prepared for the season regarding gas reserves and are also ready to save. You need to understand that new gas supplies will come mainly from the Baltic countries and the United States. Gas supplies from America are more expensive, because logistics services incur additional costs. In order to keep prices at this level, gas producing countries need to increase gas production, which creates additional difficulties and waste. And most likely, during this heating season, gas prices will rise again.

Natural Gas | Need More LowThursday, 20 October 2022
16:13 PM (WIB)
Natural Gas is entering a bullish area as it broke 61.8% but still heading to 78.6% or even more low.
I’m expecting the price could hit the ground support for more easy and minimalist risk to trades.
If the price reaches the ground support, the Head and Shoulder Structure Patterns would be the best direction to trade.

Oct 19,22-NG down to 5.5-going all in BUYSo price action has continued to fall and I'm leveraged a bit now. I put in another Buy order at 5.5 wondering if tomorrow is the day when price action rebounds because of the storage report. Who knows - it's anyones guess. Price might fall down to 5, I dunno.
But if it rebounds tomorrow, I'll be in good shape. Price has continued to fall because of warmer than expected weather across the U.S. throughout Oct and into the beginning of Nov.
As soon as that first cold snap comes, I will be sitting pretty to take advantage.
Stay safe all.
Heiko

NGSuper oversold but tapped the daily demand zone today. I'm long some BOIL for a short term bounce. Hedge on the increased heating bills to come this winter lol.

Natural gas - approaching critical zoneTrendline and horizontal support lines approaching
What happens here will be critical for NG bulls

Natural Gas Selling OffNatural gas has been extremely volatile this year and has recently broken below major trendline support and continued selling off. Even with the volatility we have seen, with sharp moves higher followed by sharp moves lower, the market is still up almost $2 on the year, and we are looking to test a strong support level from the July lows. This market is the most oversold we have seen since before the pandemic, and the market has responded very positively this year off oversold levels. If the market can hold support at the July lows, we could see a nice bounce higher and look to test the 50-day moving average, which is now strong resistance.

NATURAL GAS Futures (NG1!), H4 Potential for Bearish MomentumType: Bearish Momentum
Resistance: 600.5
Pivot: 516.5
Support: 327.8
Preferred Case: On H4, as the price moving below ichimoku cloud and descending channel, we have a bearish bias that the price may drop from the pivot at 516.5. which is in line with the overlap resistance to the 1st support at 327.8, where the 127.2% fibonacci extension is.
Alternative scenario: Alternatively, the price may rise to the 1st resistance at 600.5, which is in line with the 38.2% fibonacci retracement.
Fundamentals: There are no major news.

NG1! Reloading time may be approaching(BG) GAS appears to be nearing the completion of a large flat A-B-C structure. monitoring for long setups. Looking for an RSI divergence and a low below 5.35 then start collecting/building small positions. The 5.00/4.65, .618 fib, and major yellow trendline price should provide support for a bounce. If count is off by a wave It could bounce before then so keep monitoring using your own due dill. obviously a break below the trendline would be bearish and expect a retest of the trendline before continuing lower

Cycle Analysis on Natural GasEach day we hear about energy crisis, but not that much about the 40% drop on natural gas in the last 2 months. 20-22 price action looks similar to 99-01. More weakness coming?

Follow up on the nat gas wedge from 2020Look like it is playing out just like the last massive inflation cycle we saw. There was no indicator of the Russia Ukraine war at the time of posting the original wedge. Having posted this two years ago at the beginning of the blow off top and seeing how things unfolded. I will be hunting more cycle plays like this one

Oct 17,22-NG Put in a Buy Order @ 6So price action has dropped like crazy for NG...I still have my Buy order at 7 so I added another Buy order at 6.
I think the lowest price will go will be around 5.5. I will put another Buy Order in at 5.5 if it gets that low, otherwise I will ride the price action back up to infinity and beyond!
ok....maybe just to 10 or so.
Anyway, stay safe everyone - as you can see, price action is now OUTSIDE the Linerar Regression Indicator so price should be going up any week now. Not to mention the War and the Winter and Euro and Asian NG prices skyrocketing...anyway.
Heiko

✅NATGAS MOVE DOWN AHEAD|SHORT🔥
✅NATGAS was trading along the rising support
But now we are seeing a bearish breakout
So I am bearish biased and I think
That the price will fall down
To retest the demand level below
SHORT🔥
✅Like and subscribe to never miss a new idea!✅

NATURAL GAS Support Ahead! Buy!
Hello,Traders!
NATURAL GAS is going down
But a horizontal support level
Is ahead so after the retest
A bullish rebound is likely
To happen with the retest
Of the target level above
Buy!
Like, comment and subscribe to boost your trading!
See other ideas below too!

Natural gas going to support ??Natural gass going to support at 477 is final reversable support .. aftert that may trend change happen

NG - The ConsolidationFor the last few weeks, NG has been consolidating as the other financial markets move all over the place.
The bearish head & shoulders pattern from June/August may not apply anymore due to the flattening. In previous natural gas declines (like late 2005-early 06) it would decline quickly and sharply after showing this sort of pattern. This does not look anything like that.
Even if it were to go down further, it needs to go up to some sort of support (I marked the ~$7.80 on my chart) so that it can regain the lost momentum. It seems to be bouncing off a longer-term trendline, which could be problematic.
That being said, it doesn't have to be very volatile and it could quickly reject.
I would recommend waiting for it to go to some sort of level and entering short there. My overall bias on this chart & natural gas in general is to the short side. Every time NG has been up to these levels for whatever reason, it goes back down again even if just to $4 or $5.
Any sort of breakdown below the trendline could also hold.
The winter is coming up, though, and you may have to adjust for a slight bullish bias if you plan to keep holding anything.

Daily NG analysisDaily NG analysis
Sell trade with target and stop loss as shown in the chart
The trend is down and we may see more drop in the coming period in the medium term
All the best, I hope for your participation in the analysis, and for any inquiries, please send in the comments.
He gave a signal from the strongest areas of entry, special recommendations, with a success rate of 95%, for any inquiry or request for analysis, contact me

Natural Gas: The supply-demand dynamic is at a critical stageDeutsche Bank reported that in a particularly critical phase is the supply-demand dynamics regarding natural gas towards the winter season, which the behavior of households will be decisive in the coming months, as their consumption represents a large percentage of total consumption. A supply failure is likely to be avoided at least as the scenarios confirm that a 20% YoY reduction in consumption this winter (and flat annual demand thereafter) is likely to lead to some shortages either early in 2023 or the winter of 2023/24.
The reduction in Germany remains at 40%, while if demand falls by only 10% YoY stocks will not be exhausted even in such a scenario. For certain, fill levels would fall below 10% in late winter 2022/23, but this would not put energy security in doubt until 2024. The European Commission is working on proposals to limit prices. While negotiating with reliable suppliers, for instance, Norway, and strengthening common markets seem to be the Commission’s preferred options, the idea of a (temporary) price cap on imported natural gas is gaining ground.
The greater the potential for the implementation of a cap the lower the success of the implementation of the first two measures. Such an implementation could lead to increase supply risks, depending on the design of such an import price cap which would accompany the mandatory demand reduction.
From an Elliot wave perspective, we will examine the Natural Gas chart to see its potential move in the short to mid-term.
Looking at the weekly chart, natural gas made an impulsive five-wave rally from the lows, which suggests that low is in place and we can expect a bigger recovery. However, in Elliott waves, after every five-wave rise we can expect a slow down in three waves, so we are tracking now an (A)-(B)-(C) correction before the uptrend resumes. First support is around 5.3 level, while second support would be around 3.5 level.
All the best!
If you like what we do, then please like and share our idea.
Disclosure: Please be informed that information we provide is NOT a trading recommendation or investment advice. All of our work is for educational purposes only.

Natural Gas Futures ( QG1! ), H4 Potential for Bearish MomentumType: Bearish Momentum
Resistance: 7.475
Pivot: 6.900
Support: 6.310
Preferred Case: The H4 price is in a slightly descending trend with prices trading below the ichimoku . The price may drop form the pivot at 6.900 to the support at 6.310 where the 78.6% retracement and swing low sits
Alternative scenario: If there is a price reversal, it might test the 1st resistance at 7.475, where the 38.2% Fibonacci and 78.6% projection sits
Fundamentals: There are no major news.
