Ryan Specialty Holdings (RYAN): Super Stock!Fundamentals:
RYAN (Ryan Specialty Holdings) is a super stock in my book. The balance sheet is booming off the charts with accelerating earnings and sales. It is in a healthy industry and has great cashflow. Some off-loading of funds for a quarter, but that is probably temporary. 73% return on equ
Next report date
—
Report period
—
EPS estimate
—
Revenue estimate
—
0.55USD
61.03 MUSD
2.10 BUSD
97.37 M
About Ryan Specialty Holdings, Inc.
Sector
Industry
CEO
Patrick G. Ryan
Website
Headquarters
Chicago
Employees (FY)
4.35 K
Founded
2010
FIGI
BBG011K4W134
Ryan Specialty Holdings, Inc. engages in the provision of specialty products and solutions for insurance brokers, agents, and carriers. It offers wholesale brokerage, binding authority, and underwriting management. The company was founded by Patrick G. Ryan Sr. in 2010 and is headquartered in Chicago, IL.

$RYAN LongWhen I see a the CEO buying large amounts of the company in which they are managing I get to looking into the company. When I look at the technicals for this company. My checklist gets checked, some volume coming in, MACD crossover, EMA 8 closing the EMA 21 and RSI is under the 50. I see a 312 rever

$RYAN Continuation Head and Shoulders setuphere is $RYAN potential continuation head and shoulders pattern but this needs to tighten way down below that supply line for me to get interested.
Again, more of the same, base building but not buyable yet.
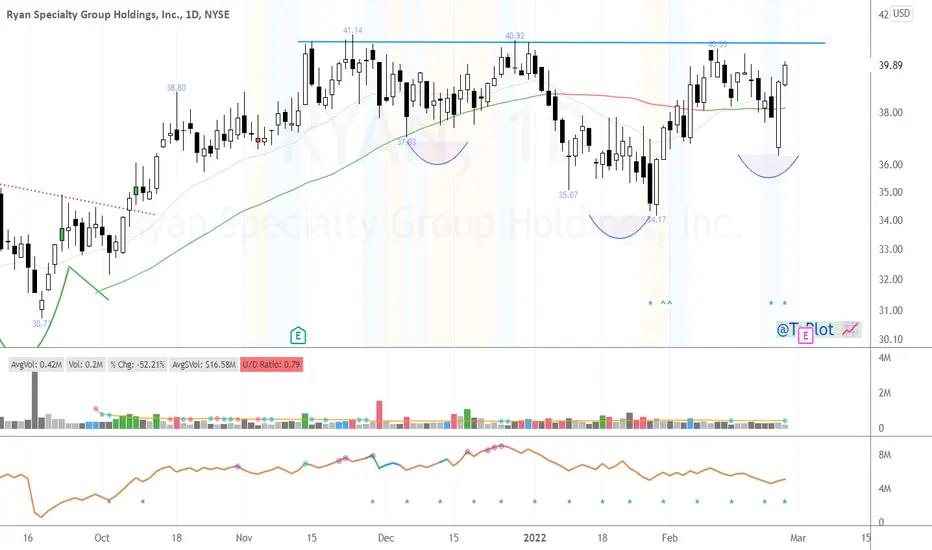
$RYAN Possible Breakout into ATHs$RYAN another potential leader setting up for a breakout into ATHs. Worth keeping an eye on this to see how it shape up below that supply line.
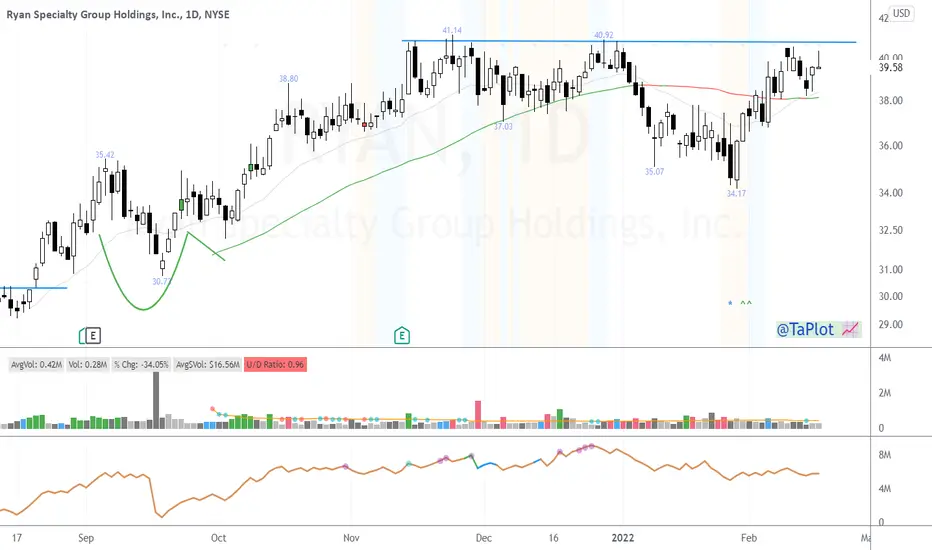
$RYANOne more recent IPO stocks. Strong chart. Interesting above $41
Also regained most $ lost in fall

US Stock In Play: $RYAN$RYAN 6mth old insurance name IPO. based off (-12%) the January market weakness and looking to reclaim its ATH close of $40.36. RS is at ATH.
trading above all critical VWAPs, MAs. a trading idea to take on BO for further trending action.

$RYAN Looking to Breakout to ATHsHow many IPOs are sitting right below their ATHs and looking this good?
$RYAN has to be top focus heading into this week.
Checking off so many boxes.

RYANRyan Specialty Group Holdings Inc (NYSE:RYAN) broke out to a new all-time high on Friday, accompanied by a solid volume suggesting higher levels. The technical chart still shows a bullish bias. I suspect the stock may continue to appreciate over the coming sessions.

$RYAN: Ryan is Smilin'As the fed moves towards tapering, I will be building a position in RYAN around 35. Will look to add on quality pullbacks assuming $XLF maintains an upward trajectory

$RYAN Cup with Handle$RYAN small cup with handle right at its highs while the market is correcting. Bullish action. Making it to my watchlist

See all ideas
An aggregate view of professional's ratings.
Trade directly on the supercharts through our supported, fully-verified and user-reviewed brokers.


Curated watchlists where RYAN is featured.

Frequently Asked Questions
The current price of RYAN is 60.61 USD — it has increased by 2.57% in the past 24 hours. Watch Ryan Specialty Holdings, Inc. stock price performance more closely on the chart.
Depending on the exchange, the stock ticker may vary. For instance, on NYSE exchange Ryan Specialty Holdings, Inc. stocks are traded under the ticker RYAN.
RYAN stock has risen by 2.42% compared to the previous week, the month change is a 3.03% rise, over the last year Ryan Specialty Holdings, Inc. has showed a 32.83% increase.
We've gathered analysts' opinions on Ryan Specialty Holdings, Inc. future price: according to them, RYAN price has a max estimate of 70.00 USD and a min estimate of 46.00 USD. Watch RYAN chart and read a more detailed Ryan Specialty Holdings, Inc. stock forecast: see what analysts think of Ryan Specialty Holdings, Inc. and suggest that you do with its stocks.
RYAN reached its all-time high on Jun 25, 2024 with the price of 61.29 USD, and its all-time low was 25.57 USD and was reached on Jul 22, 2021. View more price dynamics on RYAN chart.
See other stocks reaching their highest and lowest prices.
See other stocks reaching their highest and lowest prices.
RYAN stock is 3.20% volatile and has beta coefficient of 0.13. Track Ryan Specialty Holdings, Inc. stock price on the chart and check out the list of the most volatile stocks — is Ryan Specialty Holdings, Inc. there?
Today Ryan Specialty Holdings, Inc. has the market capitalization of 7.04 B, it has increased by 1.28% over the last week.
Yes, you can track Ryan Specialty Holdings, Inc. financials in yearly and quarterly reports right on TradingView.
Ryan Specialty Holdings, Inc. is going to release the next earnings report on Aug 1, 2024. Keep track of upcoming events with our Earnings Calendar.
RYAN earnings for the last quarter are 0.35 USD per share, whereas the estimation was 0.35 USD resulting in a 0.13% surprise. The estimated earnings for the next quarter are 0.56 USD per share. See more details about Ryan Specialty Holdings, Inc. earnings.
Ryan Specialty Holdings, Inc. revenue for the last quarter amounts to 552.05 M USD, despite the estimated figure of 549.06 M USD. In the next quarter, revenue is expected to reach 695.56 M USD.
RYAN net income for the last quarter is 15.98 M USD, while the quarter before that showed 22.15 M USD of net income which accounts for −27.83% change. Track more Ryan Specialty Holdings, Inc. financial stats to get the full picture.
Yes, RYAN dividends are paid quarterly. The last dividend per share was 0.11 USD. As of today, Dividend Yield (TTM)% is 0.58%. Tracking Ryan Specialty Holdings, Inc. dividends might help you take more informed decisions.
Ryan Specialty Holdings, Inc. dividend yield was 0% in 2023, and payout ratio reached 0%. The year before the numbers were 0% and 0% correspondingly. See high-dividend stocks and find more opportunities for your portfolio.
As of Jul 27, 2024, the company has 4.35 K employees. See our rating of the largest employees — is Ryan Specialty Holdings, Inc. on this list?
EBITDA measures a company's operating performance, its growth signifies an improvement in the efficiency of a company. Ryan Specialty Holdings, Inc. EBITDA is 646.25 M USD, and current EBITDA margin is 29.05%. See more stats in Ryan Specialty Holdings, Inc. financial statements.
Like other stocks, RYAN shares are traded on stock exchanges, e.g. Nasdaq, Nyse, Euronext, and the easiest way to buy them is through an online stock broker. To do this, you need to open an account and follow a broker's procedures, then start trading. You can trade Ryan Specialty Holdings, Inc. stock right from TradingView charts — choose your broker and connect to your account.
Investing in stocks requires a comprehensive research: you should carefully study all the available data, e.g. company's financials, related news, and its technical analysis. So Ryan Specialty Holdings, Inc. technincal analysis shows the strong buy rating today, and its 1 week rating is strong buy. Since market conditions are prone to changes, it's worth looking a bit further into the future — according to the 1 month rating Ryan Specialty Holdings, Inc. stock shows the strong buy signal. See more of Ryan Specialty Holdings, Inc. technicals for a more comprehensive analysis.
If you're still not sure, try looking for inspiration in our curated watchlists.
If you're still not sure, try looking for inspiration in our curated watchlists.