Swing 1H trade LONG Hi check my oportunity. We go on 1h long position i trust X2 or X5 good risk reward. Good Luck. L.
Next report date
—
Report period
—
EPS estimate
—
Revenue estimate
—
−0.50USD
−281.70 MUSD
15.78 BUSD
153.26 M
About Stanley Black & Decker, Inc.
Sector
Industry
CEO
Donald Allan
Website
Headquarters
New Britain
Employees (FY)
50.5 K
Founded
1843
FIGI
BBG000BTQR96
Stanley Black & Decker, Inc. engages in the provision of power and hand tools, and related accessories, products, services and equipment for oil and gas, infrastructure applications, commercial electronic security and monitoring systems, healthcare solutions, and mechanical access solutions. It operates through the Tools and Storage segment, and Industrial segment. The Tools and Storage segment consists of power tools and equipment, hand tools, accessories, and storage businesses. The Industrial segment includes the engineered fastening and infrastructure businesses. The company was founded by Frederick T. Stanley in 1843 and is headquartered in New Britain, CT.

Stanley Black & Decker Surges Why?Stanley Black & Decker shares jumped more than 8% Saturday after it boosted its profit forecast for the year. The tool maker said its cost-cutting efforts are paying off. Stanley now expects $1.10 to $1.40 in adjusted earnings per share in 2023, up from its past guidance of $0.70 to $1.30.
The tool

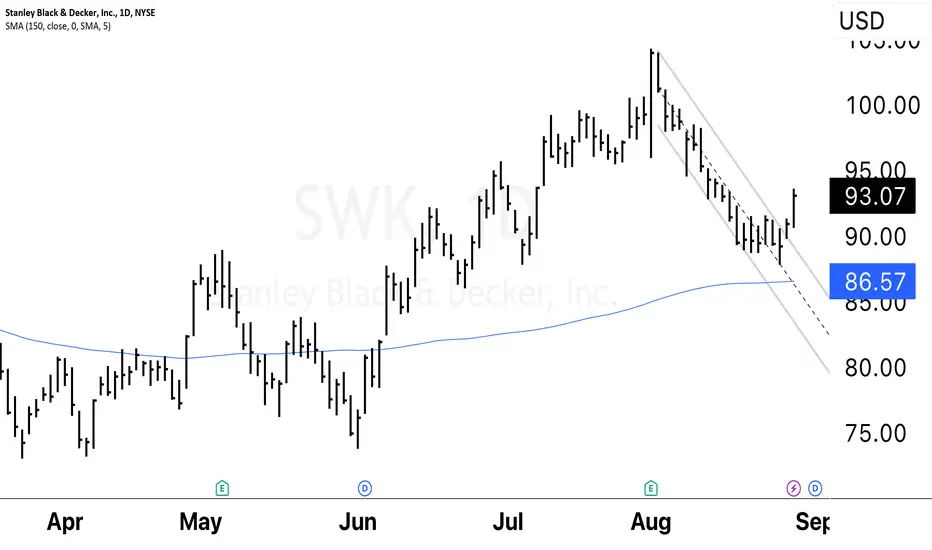
$SWK Bearish Parallel Down Trend BreakNYSE:SWK Bearish Parallel Down Trend Break to bullish reversal. The analysis of the potential bearish-to-bullish reversal in the context of NYSE:SWK (Stanley Black & Decker, Inc.) involves examining key price movements and technical patterns. Specifically, the break of a parallel down trend and i
SWK - Head and shouldersOn this chart, we can see a head and shoulders-formation and we are therefore waiting for a breakout of the neckline, to take our short position.
Stop-loss, target and ROI are all shown on the chart.
The target for this trade equals the earlier support level.
In this case, it shows that during the

$SWK with a Bullish outlook following its earnings #Stocks The PEAD projected a bullish outlook for $SWK after a positive under reaction following its earnings release placing the stock in drift A with an expected accuracy of 100%.
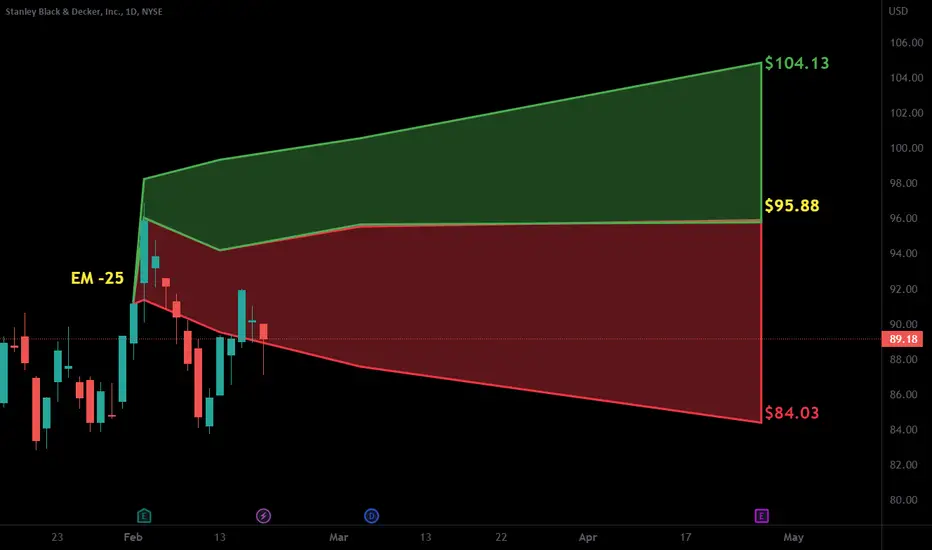

SWK protective options strategyEveryone has some trusty item made by Stanley Black & Decker in their home, whether it's a power tool, lawn product, kitchen appliance, storage, etc. Its customers also include professional end users of its equipment for repairs, construction, lawncare, automotive, manufacturing, oil and gas pipelin


Stanley Black Decker USA Sun Storm Investment Trading Desk & NexGen Wealth Management Service Present's: SSITD & NexGen Portfolio of the Week Series
Focus: Worldwide
By Sun Storm Investment Research & NexGen Wealth Management Service
A Profit & Solutions Strategy & Research
Trading | Investment | Stocks | ETF | Mutua

$SWK with a Bullish outlook following its earnings #Stocks The PEAD projected a Bullish outlook for $SWK after a Negative Under reaction following its earnings release placing the stock in drift D with an expected accuracy of 50%.

See all ideas
An aggregate view of professional's ratings.
Trade directly on the supercharts through our supported, fully-verified and user-reviewed brokers.


Frequently Asked Questions
The current price of SWK is 95.43 USD — it has increased by 6.54% in the past 24 hours. Watch Stanley Black & Decker, Inc. stock price performance more closely on the chart.
Depending on the exchange, the stock ticker may vary. For instance, on NYSE exchange Stanley Black & Decker, Inc. stocks are traded under the ticker SWK.
SWK stock has risen by 8.84% compared to the previous week, the month change is a 17.08% rise, over the last year Stanley Black & Decker, Inc. has showed a 2.76% decrease.
We've gathered analysts' opinions on Stanley Black & Decker, Inc. future price: according to them, SWK price has a max estimate of 110.00 USD and a min estimate of 80.00 USD. Watch SWK chart and read a more detailed Stanley Black & Decker, Inc. stock forecast: see what analysts think of Stanley Black & Decker, Inc. and suggest that you do with its stocks.
SWK stock is 8.10% volatile and has beta coefficient of 1.19. Track Stanley Black & Decker, Inc. stock price on the chart and check out the list of the most volatile stocks — is Stanley Black & Decker, Inc. there?
Today Stanley Black & Decker, Inc. has the market capitalization of 13.78 B, it has decreased by 1.59% over the last week.
Yes, you can track Stanley Black & Decker, Inc. financials in yearly and quarterly reports right on TradingView.
Stanley Black & Decker, Inc. is going to release the next earnings report on Jul 30, 2024. Keep track of upcoming events with our Earnings Calendar.
SWK earnings for the last quarter are 0.56 USD per share, whereas the estimation was 0.54 USD resulting in a 2.79% surprise. The estimated earnings for the next quarter are 0.84 USD per share. See more details about Stanley Black & Decker, Inc. earnings.
Stanley Black & Decker, Inc. revenue for the last quarter amounts to 3.87 B USD, despite the estimated figure of 3.83 B USD. In the next quarter, revenue is expected to reach 4.02 B USD.
SWK net income for the last quarter is 19.50 M USD, while the quarter before that showed −276.10 M USD of net income which accounts for 107.06% change. Track more Stanley Black & Decker, Inc. financial stats to get the full picture.
Yes, SWK dividends are paid quarterly. The last dividend per share was 0.81 USD. As of today, Dividend Yield (TTM)% is 3.62%. Tracking Stanley Black & Decker, Inc. dividends might help you take more informed decisions.
As of Jul 27, 2024, the company has 50.50 K employees. See our rating of the largest employees — is Stanley Black & Decker, Inc. on this list?
EBITDA measures a company's operating performance, its growth signifies an improvement in the efficiency of a company. Stanley Black & Decker, Inc. EBITDA is 1.82 B USD, and current EBITDA margin is 9.72%. See more stats in Stanley Black & Decker, Inc. financial statements.
Like other stocks, SWK shares are traded on stock exchanges, e.g. Nasdaq, Nyse, Euronext, and the easiest way to buy them is through an online stock broker. To do this, you need to open an account and follow a broker's procedures, then start trading. You can trade Stanley Black & Decker, Inc. stock right from TradingView charts — choose your broker and connect to your account.
Investing in stocks requires a comprehensive research: you should carefully study all the available data, e.g. company's financials, related news, and its technical analysis. So Stanley Black & Decker, Inc. technincal analysis shows the strong buy rating today, and its 1 week rating is buy. Since market conditions are prone to changes, it's worth looking a bit further into the future — according to the 1 month rating Stanley Black & Decker, Inc. stock shows the neutral signal. See more of Stanley Black & Decker, Inc. technicals for a more comprehensive analysis.
If you're still not sure, try looking for inspiration in our curated watchlists.
If you're still not sure, try looking for inspiration in our curated watchlists.