first 334 to 315 now 336 to 348It seems to be heading across this line, but in case it doesn't, it could drop to 334 from 348 or 315, a few areas of support in a very bullish uptrend, until I see something remarkable.
Next report date
—
Report period
—
EPS estimate
—
Revenue estimate
—
9.44USD
2.02 BUSD
17.68 BUSD
225.56 M
About Trane Technologies plc
Sector
Industry
CEO
Dave S. Regnery
Website
Headquarters
Swords
Employees (FY)
40 K
Founded
2009
ISIN
IE00BK9ZQ967
FIGI
BBG000BM6788
Trane Technologies Plc engages in providing solutions to buildings, homes, and transportation. It operates through the following business segments: Americas, EMEA, and Asia Pacific. The Americas segment encompasses commercial heating and cooling systems, building controls, and energy services and solutions, residential heating and cooling, and transport refrigeration systems, and solutions in North America and Latin America regions. The EMEA segment includes heating and cooling systems, services and solutions for commercial buildings, and transport refrigeration systems and solutions in Europe, Middle East, and Africa regions. The Asia Pacific segment is involved in heating and cooling systems, services and solutions for commercial buildings and transport refrigeration systems and solutions in Asia Pacific region. The company was founded in 1871 and is headquartered in Swords, Ireland.

TT Entry, Volume, Target, Stop
Entry: with price above 338.09
Volume: with volume greater than 539k. The more volume the better.
Target: 367.31 area. This is an area, you might consider existing early if price drops below a significant moving average such as the 10, 20, or 50 EMA. You might also considering holding some

TT - Double TopTT Is showing signs that it wants to double top and I have drawn a channel that contains these tops.
Expect moves down as indicated by the placed bars pattern.
Double Tops are a bearish pattern.
An inverted H&S is also present in green which can be indicative of a trend change which supports the bea

$TT with a Bullish outlook following its earnings #Stocks The PEAD projected a bullish outlook for $TT after a positive under reaction following its earnings release placing the stock in drift A.
$TT with a Bullish outlook following its earnings #Stocks The PEAD projected a Bullish outlook for $TT after a Positive Under reaction following its earnings release placing the stock in drift A.

$TT with a Bullish outlook following its earnings #Stocks The PEAD projected a Bullish outlook for $TT after a Positive Under reaction following its earnings release placing the stock in drift A.

TT - Incredible BreakoutHorizontal trading has been occurring for a long time Finally price has broken out of this range This break out will be spectacular as it moves out of this range

$TT with a Bearish outlook following its earnings #Stocks The PEAD projected a Bearish outlook for $TT after a Negative Under reaction following its earnings release placing the stock in drift D.

11/4/2022 NYSE (TT)Short (Entry Price) below the black line and exit (Stop Loss) above the red line. Can take profit at the suggested Target Price.
Entry Price: $151.44
Target Price: $149.13
Stop Loss: $153.75

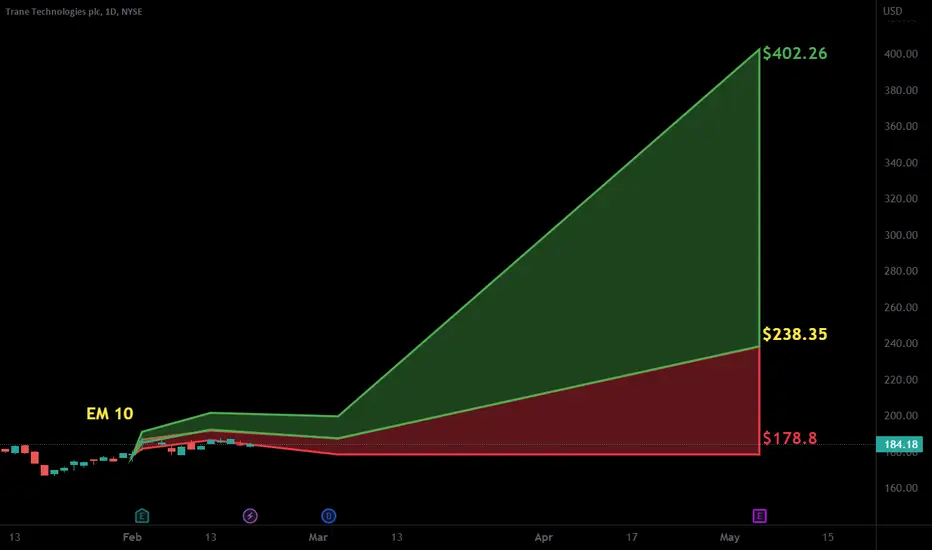
TT - Trane - LongIt looks like Trane Technologies is in a Bullish Bat formation that will reach bottom at around $146 which is also in confluence where the 1.618 fib lines up.
At this point TT should change directions and start on its next move higher.

See all ideas
An aggregate view of professional's ratings.
Trade directly on the supercharts through our supported, fully-verified and user-reviewed brokers.


Frequently Asked Questions
The current price of TT is 329.71 USD — it has increased by 2.32% in the past 24 hours. Watch Trane Technologies plc stock price performance more closely on the chart.
Depending on the exchange, the stock ticker may vary. For instance, on NYSE exchange Trane Technologies plc stocks are traded under the ticker TT.
TT stock has fallen by 0.69% compared to the previous week, the month change is a 1.17% fall, over the last year Trane Technologies plc has showed a 68.90% increase.
We've gathered analysts' opinions on Trane Technologies plc future price: according to them, TT price has a max estimate of 385.00 USD and a min estimate of 300.00 USD. Watch TT chart and read a more detailed Trane Technologies plc stock forecast: see what analysts think of Trane Technologies plc and suggest that you do with its stocks.
TT stock is 3.44% volatile and has beta coefficient of 1.55. Track Trane Technologies plc stock price on the chart and check out the list of the most volatile stocks — is Trane Technologies plc there?
Today Trane Technologies plc has the market capitalization of 72.94 B, it has increased by 2.84% over the last week.
Yes, you can track Trane Technologies plc financials in yearly and quarterly reports right on TradingView.
Trane Technologies plc is going to release the next earnings report on Jul 31, 2024. Keep track of upcoming events with our Earnings Calendar.
TT earnings for the last quarter are 1.94 USD per share, whereas the estimation was 1.65 USD resulting in a 17.57% surprise. The estimated earnings for the next quarter are 3.08 USD per share. See more details about Trane Technologies plc earnings.
Trane Technologies plc revenue for the last quarter amounts to 4.20 B USD, despite the estimated figure of 4.00 B USD. In the next quarter, revenue is expected to reach 5.13 B USD.
TT net income for the last quarter is 436.30 M USD, while the quarter before that showed 504.30 M USD of net income which accounts for −13.48% change. Track more Trane Technologies plc financial stats to get the full picture.
Yes, TT dividends are paid quarterly. The last dividend per share was 0.84 USD. As of today, Dividend Yield (TTM)% is 0.99%. Tracking Trane Technologies plc dividends might help you take more informed decisions.
Trane Technologies plc dividend yield was 1.23% in 2023, and payout ratio reached 34.20%. The year before the numbers were 1.59% and 35.84% correspondingly. See high-dividend stocks and find more opportunities for your portfolio.
As of Jul 27, 2024, the company has 40.00 K employees. See our rating of the largest employees — is Trane Technologies plc on this list?
EBITDA measures a company's operating performance, its growth signifies an improvement in the efficiency of a company. Trane Technologies plc EBITDA is 3.44 B USD, and current EBITDA margin is 18.40%. See more stats in Trane Technologies plc financial statements.
Like other stocks, TT shares are traded on stock exchanges, e.g. Nasdaq, Nyse, Euronext, and the easiest way to buy them is through an online stock broker. To do this, you need to open an account and follow a broker's procedures, then start trading. You can trade Trane Technologies plc stock right from TradingView charts — choose your broker and connect to your account.
Investing in stocks requires a comprehensive research: you should carefully study all the available data, e.g. company's financials, related news, and its technical analysis. So Trane Technologies plc technincal analysis shows the neutral today, and its 1 week rating is buy. Since market conditions are prone to changes, it's worth looking a bit further into the future — according to the 1 month rating Trane Technologies plc stock shows the buy signal. See more of Trane Technologies plc technicals for a more comprehensive analysis.
If you're still not sure, try looking for inspiration in our curated watchlists.
If you're still not sure, try looking for inspiration in our curated watchlists.