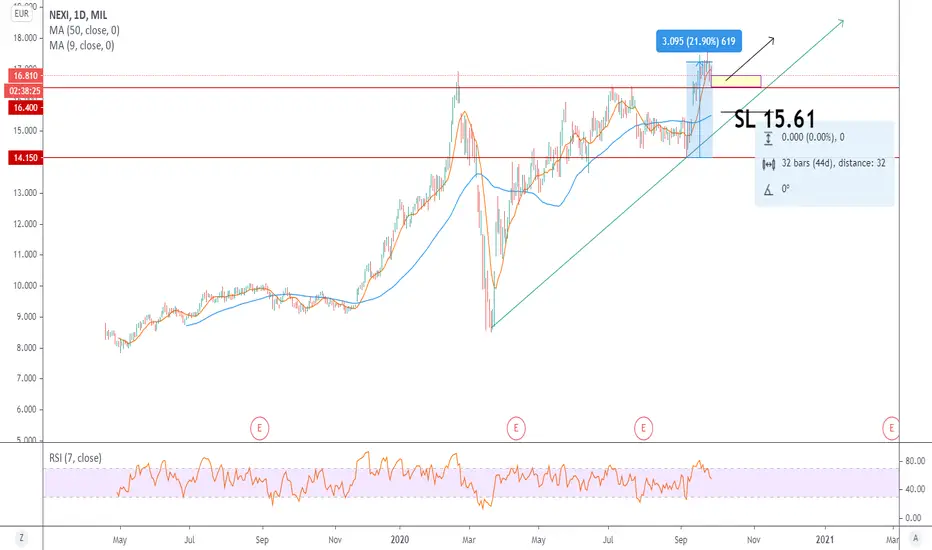
Medium-Long Term NEXIA few lines and indicators to explain the potential of this asset.
The stock of the company that manages electronic payments and credit cards, has returned to the attention of investors due to rumors about a possible merger with Sia, the Milanese group of services for the banking system controlled b
Next report date
—
Report period
—
EPS estimate
—
Revenue estimate
—
−0.85USD
−1.11 BUSD
6.52 BUSD
571.78 M
About NEXI
Sector
Industry
CEO
Paolo Bertoluzzo
Website
Headquarters
Milan
Employees (FY)
10.58 K
Founded
1939
ISIN
IT0005366767
FIGI
BBG00QT68384
Nexi SpA provides payment technology solutions which enable banks, merchants, and consumers to make and receive digital payments. It operates through the following business units: Merchant Solutions, Issuing Solutions, and Digital Banking Solutions. The company was founded in 1939 and is headquartered in Milan, Italy.
daily analysis NEXIHi friends
the daily chart of this market shows that it will experience an uptrend in the coming days with a high probability but at the same time you have to be vigilant of the change from the direction to the opposite
please subscribe to receive more analyzes

Nexi SpA (NEXI - Italy) - ABC wave patternNexi SpA (NEXI - Italy) is in ABC wave pattern in 60 min time frame. Currently price is in internal 3rd wave of C wave up (or 3rd wave of Impulse), which easily can make a new high. In daily time frame it will be in either Y wave or C impulse wave up.

See all ideas
Trade directly on the supercharts through our supported, fully-verified and user-reviewed brokers.


Frequently Asked Questions
The current price of NEXPF is 5.92 USD — it has decreased by 2.15% in the past 24 hours. Watch NEXI S.P.A. stock price performance more closely on the chart.
Depending on the exchange, the stock ticker may vary. For instance, on OTC exchange NEXI S.P.A. stocks are traded under the ticker NEXPF.
We've gathered analysts' opinions on NEXI S.P.A. future price: according to them, NEXPF price has a max estimate of 10.82 USD and a min estimate of 5.95 USD. Watch NEXPF chart and read a more detailed NEXI S.P.A. stock forecast: see what analysts think of NEXI S.P.A. and suggest that you do with its stocks.
NEXPF reached its all-time high on Jun 25, 2021 with the price of 22.54 USD, and its all-time low was 5.92 USD and was reached on May 3, 2024. View more price dynamics on NEXPF chart.
See other stocks reaching their highest and lowest prices.
See other stocks reaching their highest and lowest prices.
NEXPF stock is 2.20% volatile and has beta coefficient of 0.93. Track NEXI S.P.A. stock price on the chart and check out the list of the most volatile stocks — is NEXI S.P.A. there?
Today NEXI S.P.A. has the market capitalization of 8.52 B, it has increased by 1.75% over the last week.
Yes, you can track NEXI S.P.A. financials in yearly and quarterly reports right on TradingView.
NEXI S.P.A. is going to release the next earnings report on Jul 31, 2024. Keep track of upcoming events with our Earnings Calendar.
NEXPF earnings for the last half-year are 0.33 USD per share, whereas the estimation was 0.36 USD, resulting in a −9.09% surprise. The estimated earnings for the next half-year are 0.27 USD per share. See more details about NEXI S.P.A. earnings.
NEXI S.P.A. revenue for the last half-year amounts to 1.97 B USD, despite the estimated figure of 1.96 B USD. In the next half-year revenue is expected to reach 1.77 B USD.
NEXPF net income for the last half-year is −1.15 B USD, while the previous report showed 35.41 M USD of net income which accounts for −3.34 K% change. Track more NEXI S.P.A. financial stats to get the full picture.
No, NEXPF doesn't pay any dividends to its shareholders. But don't worry, we've prepared a list of high-dividend stocks for you.
As of Jun 12, 2024, the company has 10.58 K employees. See our rating of the largest employees — is NEXI S.P.A. on this list?
EBITDA measures a company's operating performance, its growth signifies an improvement in the efficiency of a company. NEXI S.P.A. EBITDA is 1.51 B USD, and current EBITDA margin is 23.21%. See more stats in NEXI S.P.A. financial statements.
Like other stocks, NEXPF shares are traded on stock exchanges, e.g. Nasdaq, Nyse, Euronext, and the easiest way to buy them is through an online stock broker. To do this, you need to open an account and follow a broker's procedures, then start trading. You can trade NEXI S.P.A. stock right from TradingView charts — choose your broker and connect to your account.
Investing in stocks requires a comprehensive research: you should carefully study all the available data, e.g. company's financials, related news, and its technical analysis. So NEXI S.P.A. technincal analysis shows the sell today, and its 1 week rating is sell. Since market conditions are prone to changes, it's worth looking a bit further into the future — according to the 1 month rating NEXI S.P.A. stock shows the sell signal. See more of NEXI S.P.A. technicals for a more comprehensive analysis.
If you're still not sure, try looking for inspiration in our curated watchlists.
If you're still not sure, try looking for inspiration in our curated watchlists.