QTUM - Another Gem Set To PumpQTUM Rank 185
Here's another coin in a great position!
TQTUM in a choppy descending wedge building bullish cause as the undulations settle down.
Notice the RSI rising.
I think this will pump at some point in this area 👍.
Not advice.
Key stats
About Qtum

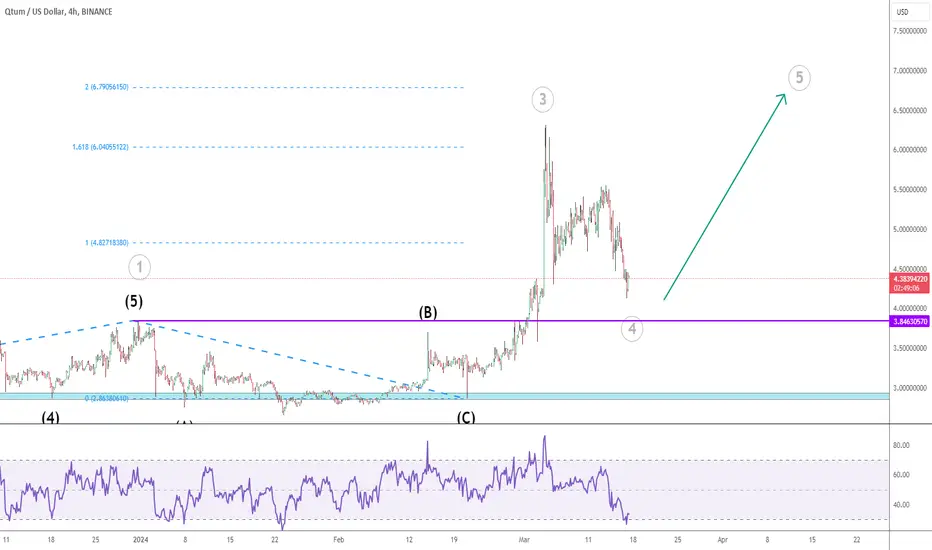
QTUM Update
Gray wave 2 happened as a flat correction, and price pumped for gray wave 3.
Wave 4 correction should stay above 3.846. If this price breaks, the count invalidates.
Quantum (QTUM)Quantum chart is interesting: a fluctuating start and a small up, followed by a long and deep correction, then a strong upward move, and again a correction move, which seems to form a harmonic pattern. After the harmonic pattern ended and when price broke the downtrend line, an impulse upward wave s

qtum high potention.QTUM is a blockchain project that aims to connect the best of Bitcoin and Ethereum. Since 2021, the team has mainly focused on DeFi (Decentralized Finance).

QTUM price prepares breakout run to $10Consolidation Phase: QTUM is currently in a prolonged consolidation phase, indicating a potential breakout.
Golden Crossover Potential: The weekly chart shows the possibility of a golden crossover, a bullish signal.
Price Range Trapped: Post-2021 bear market, QTUM's price has been trapped in a conso

Will Qtum be next?Gas has shown incredible gains during past 30 days (+1000%). Although there is no relation between the two, Qtum is following the same chart structure as Gas. That’s why I am anticipating a strong upward move on Qtum anytime soon.

QTUM Bullish UpdateThe green trendline support was tested as expected (red arrow predicted in July), and we finally broke the descending wedge to the upside.
Ideally, I´d like to see a retest of the wedge´s upper trendline (blue arrow). If we get a rejection to the upside, I´ll look for long trades (green arrow).

qtumusdtBULLISH FALLING WEDGE
1st rising trend done
downtrend as correction done
breakout wedge and retest done

QTUM - Downside follow-through
The downside scenario (see related idea) is clearly playing out, and I initially expect a test of the green mid-wedge line.
$2 should offer initial support, but there is still no reason to be bullish for QTUM.

QTUM - Descending wedge
We´re looking at a year-long descending wedge, which doesn´t seem over yet.
Short term I expect a new text of the mid-wedge trendline (green), and don´t plan any longer term longs until a higher high is in place above the wedge.

See all ideas
Curated watchlists where QTUMUSD is featured.

Gen 2: Crypto is here to stay - and it's brought some friends…
19 No. of Symbols

Proof of Stake: Seeking validation?
26 No. of Symbols
See all sparks
Frequently Asked Questions
The current price of Qtum (QTUM) is 2.60836 USD — it has risen 1.50% in the past 24 hours. Try placing this info into the context by checking out what coins are also gaining and losing at the moment and seeing QTUM price chart.
The current market capitalization of Qtum (QTUM) is 274.53 M USD. To see this number in a context check out our list of crypto coins ranked by their market caps or see crypto market cap charts.
Qtum (QTUM) trading volume in 24 hours is 34.80 M USD. See how often other coins are traded in this list.
Qtum price has fallen by 5.40% over the last week, its month performance shows a 2.84% increase, and as for the last year, Qtum has increased by 2.20%. See more dynamics on QTUM price chart.
Keep track of coins' changes with our Crypto heatmap.
Keep track of coins' changes with our Crypto heatmap.
Qtum (QTUM) reached its highest price on May 7, 2021 — it amounted to 35.58530 USD. Find more insights on the QTUM price chart.
See the list of crypto gainers and choose what best fits your strategy.
See the list of crypto gainers and choose what best fits your strategy.
Qtum (QTUM) reached the lowest price of 0.82899 USD on Mar 13, 2020. View more Qtum dynamics on the price chart.
See the list of crypto losers to find unexpected opportunities.
See the list of crypto losers to find unexpected opportunities.
The current circulating supply of Qtum (QTUM) is 107.82 M USD. To get a wider picture you can check out our list of coins with the highest circulating supply, as well as the ones with the lowest number of tokens in circulation.
The safest choice when buying QTUM is to go to a well-known crypto exchange. Some of the popular names are Binance, Coinbase, Kraken. But you'll have to find a reliable broker and create an account first. You can trade QTUM right from TradingView charts — just choose a broker and connect to your account.
Crypto markets are famous for their volatility, so one should study all the available stats before adding crypto assets to their portfolio. Very often it's technical analysis that comes in handy. We prepared technical ratings for Qtum (QTUM): today its technical analysis shows the neutral signal, and according to the 1 week rating QTUM shows the strong sell signal. And you'd better dig deeper and study 1 month rating too — it's sell. Find inspiration in Qtum trading ideas and keep track of what's moving crypto markets with our crypto news feed.
Qtum (QTUM) is just as reliable as any other crypto asset — this corner of the world market is highly volatile. Today, for instance, Qtum is estimated as 1.48% volatile. The only thing it means is that you must prepare and examine all available information before making a decision. And if you're not sure about Qtum, you can find more inspiration in our curated watchlists.
You can discuss Qtum (QTUM) with other users in our public chats, Minds or in the comments to Ideas.