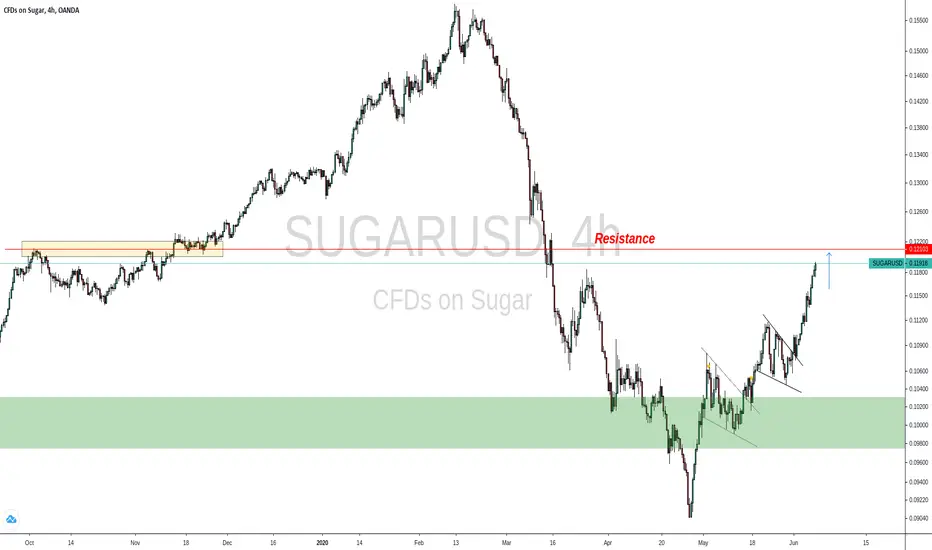
SUGAR USD BUY (SUGAR - US DOLLAR)Hi there. Price is forming a continuation pattern to the upside. Wait for the price to complete the pattern and watch strong price action for buy.
SUGARUSD trade ideas

Double Top on SugarWait for comfirm pattern (support 11,5 USD). Trend line was broken. Target 11 USD. Also MACD looks bearish.


SUGAR ($SUGARUSD) 🍬| Do we See a Sugar High or Cavities?🍦 The future of sugar futures looks sweet. Sugar futures have been trending well recently, with levels being constantly respected, so the chart is attractive from that perspective. It is especially attractive for the bulls given the current recovery on the back of the COVID correction.
With that in mind, despite the bullish price action, this hot sugar chart looks like it could cool off here and crystalize for a bit.
Below we map out a potential pathway for both the bulls and bears to find out if this sweet tooth leads to a sugar high or cavities.
Support:
If we break below the current range it isn't a great look for the current bull trend, but that doesn't mean the bulls are out of options. The S1 bullish S/R flip should act as a temporary support.
If the bulls can then bust through the current consolidation range they are in good standing, however the more likely bearish breakdown path leads to S2, which really does away with the bullish structure.
Resistance:
If the bulls can push us above the R1 and the current range then we likely continue on the sugar high. On that path the R2 S/R flip is our first real point of resistance, a reaction here likely has us testing R1 as support. If that all goes well we likely get a bullish continuation to at least the R3 order block.
Above R3 are the R4 orderblock and S/R flip cluster and finally R5 orderblock at the top.
Summary:
It currently looks like we are headed for a correction, but the bulls still have a real chance to sustain the trend here. The big danger for sugar bulls is letting a breakdown from the current range turn into a trip down to S2.
Resources: www.spglobal.com
Hit that 👍 button to show support for the content and help us grow 🐣

SELL SUGAR - SUGARUSD : SHORT Clear drop in the price and te break of the trendline - the price if below VWAP and we got volume on the short side

SUGARUSDJun 5
Good evening Friends, here my 4H-Chart idea to SUGARUSD. (In the chart you will find all information)
-> IMPORTANT: Just my opinion no financial advice.<-

UPDATE! SUGAR nice opportunity! 🦐UPDATE! SUGAR another nice opportunity, the price retested the neckline of inverse head and shoulder and just broke a descending channel.
According to Plancton's strategy We can set a nice long.
–––––
Here is the Plancton0618 technical analysis, please comment below if you have any question.
The ENTRY in the market will be taken only if the condition of Plancton0618 strategy will trigger.


Sugar Big move comingBullish on Sugar. Price is forming flag and bullish patterns everywhere.
Inversed H&S followed by a continuation pattern.
This is ripe for buys after break out or look for entry after more pull back.


Hindsight Trade during the pandemic.After the fact idea based on mitigation candle highlighted in yellow.


Sugar could retest broken support before another dropThe pullback could emerge as a double three WXY as wave W already nears completion.
Another drop then could follow in large wave C down.

Uptrend in sugar confirmed - buy opportunityIn my last post I indicated a great buy opportunity on sugar at 0.100. Now one week later, sugar is trading roughly 7.5 percent higher at 0.1075. We can see it forms a nice uptrend since the strong rebound at 0.900 price level, forming a support line with the support at 0.100.
We are dealing now with the previous local high of 0.108 early May, and we will battle with the 50 Daily EMA. However, the strong rebound, with the uptrend, breaking the downwards trend of the last months, makes me believe we will breach this level, catching attention of a lot of people.
Breakout will lead to stronger momentum and new high’s.
It’s still a good opportunity to get in now. Time it well and choose your own SL/TP levels.

SUGAR – Inverse Head and shoulder 🦐SUGAR creates an inverse Head and shoulder on historical support. As we know Inverse Head and shoulder is a common reversal sign after a long bearish environment.
We will wait a breakout on neckline and retest it with a nice volume and according with Plancton's signal we will set a nice long order
–––––
Here is the Plancton0618 technical analysis, please comment below if you have any question.
The ENTRY in the market will be taken only if the condition of Plancton0618 strategy will trigger.

SUGAR Long positionSugar bouncing on the strong resistance level, pretty much oversold.
Also, Brazil as the second major sugar exporter is beginning only now to suffer the real covid-19 pandemic, although Europe and USA are starting to open economies Brazil is shutting down yet.
The winter time is starting there now, creating a disconection between the center and the outside of the country.

SUGARUSDMay 15
Hello Friends, here my Idea to SUGARUSD. H4-Chart. (You will find the information in the chart)
-> IMPORTMANT: Just my opinion no financial advice.

Sugar: A potential move to move to the upside. 1) the recent pullback to the 50% fibonacci level seems like a valid entry to long Sugar.
2) however we shall keep in mind that the resistance level have not yet been broken.
3) we also see the MadD forming a bullish divergence.
4) depend on your Risk to reward. a stop loss below 50% fibonacci level and below the bullish engulfing candle's wick of the fibs will be good.

Long opportunity Sugar after <10 levels are clearly rejectedSugar.
It was in a clear downtrend from mid February. It tested the psychological level of 10.00 mid-april, broke through, found impulse-bounce support on 9.00, to go straight back to 10.00.
After 10.00, it broke out, and slowly retraced back to 10.
Since the impulse from 9.00 to above 10.50 went quick, and the retracement back to 10.00 slow, we can see assume a new impulse back up is likely.
Also, it seems we have broken the negative downtrend.
Since we are at the support of 10.00, broke the down trend and had slow retracement to 10.00 levels, now seems a good buy opportunity.

CFDs on SUGAR (SUGARUSD)Dates in the future with the greatest probability for a price high or price low.
The Djinn Predictive Indicators are simple mathematical equations. Once an equation is given to Siri the algorithm provides the future price swing date. Djinn Indicators work on all charts, for any asset category and in all time frames. Occasionally a Djinn Predictive Indicator will miss its prediction date by one candlestick. If multiple Djinn prediction dates are missed and are plowed through by same color Henikin Ashi candles the asset is being "reset". The "reset" is complete when Henikin Ashi candles are back in sync with Djinn price high or low prediction dates.
One way the Djinn Indicator is used to enter and exit trades:
For best results trade in the direction of the trend.
The Linear Regression channel is used to determine trend direction. The Linear Regression is set at 2 -2 30.
When a green Henikin Ashi candle intersects with the linear regression upper deviation line (green line) and both indicators intersect with a Djinn prediction date a sell is triggered.
When a red Henikin Ashi candle intersects with the linear regression lower deviation line (red line) and both indicators intersect with a Djinn prediction date a buy is triggered.
This trading strategy works on daily, weekly and Monthly Djinn Predictive charts.
Trades made when the monthly, weekly and daily arrows are pointing in the same direction are the most profitable.
This is not trading advice. Trade at your own risk.
