SUGAR up tp 0.25 next yearSUGAR up tp 0.25 next year. Analysis derived from higher timeframe. I'll add weekly image to make it clear
SUGARUSD trade ideas

Sugar trapSugar break out, but trapped in small channel so cannot find direction. Could continue up or fake-break and return to down trend?

Sugar exit from clusterit seems that with Friday's trades sugar has entered a new zone, both in D and W . If the season keeps surprising with the weather, sugar could easily reach the upper bands of the fork. there three more serious hurricanes approaching the continent , could present situations


SUGAR where are you going?SUGARUSD is in a downtrend and for that we look for good short entries and I can see 2 nice entries one is after ABC completion and one after the 5 wave correction. If price drops from actual level I would wait a flag after lower red line to entry.

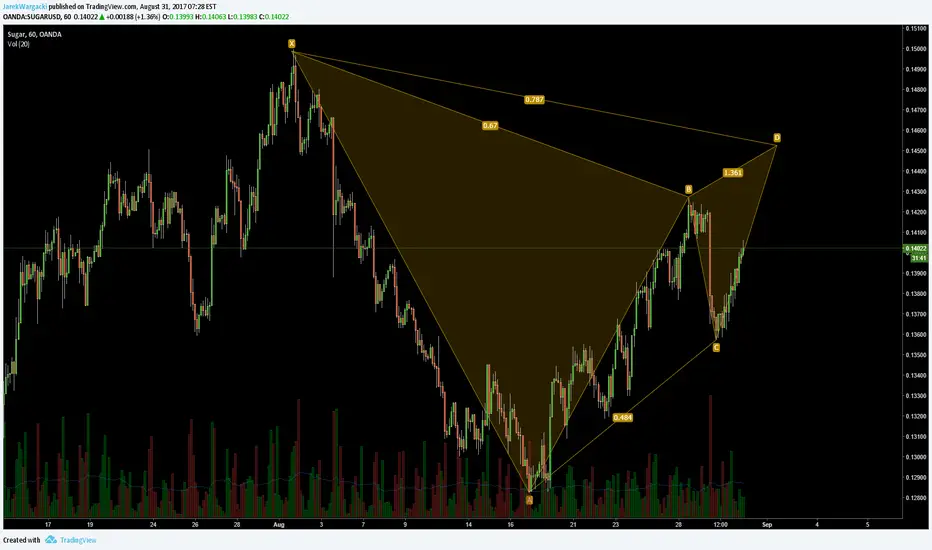
Long CandyIDEA: Expecting long move with support at 14127 @ Daily Average pivot & resistance @ Daily S2 pivot 14538 . Looking for Fibonacci support along the way to confirm the trend move. If daily average fails, expecting further support at 14049.
DISCLAIMER:
This is where I practice ideas and work on my trading techniques. Please note I am only providing my own trading information for insight to my trading techniques, you should do your own due diligence and not take this information as a trade signal. Trade at your own risk.


SUGAR - Ten times more expensive candyYour favorite cookie or candy bar will be 10 times more expensive in just a few years....

lonnngg sugaaaaorder block (purple area) held as support. sugar had strong rally off it and looks to be currently consolidating with a bull flag.
seasonal cycle also shows sugar bullish trend.
EMAs show bullish trend.
bearish market structure broke in July and currently showing bullish structure.

Early bullish signalsSugar may deliver a bullish breakout soon. It already shows some early bullish signals at equilibrium.
- Ichimoku is neutral. It will tudn bullish if price spikes above Kumo, later you will have to monitor Senkou Span cross (Kumo twist) ahead, and Chikou/past candles cross as confirming signals.
- Heikin-Ashi may turn bullish. Green candle after price failed to break back below Kijun Sen. Need to see a confirmation in form of haDelta+ and haOscillator cross up above their mid lines.
- Price is above Kijun Sen and EWO is green.
- MACD points up, but below mid line -> consolidation.
Real key levels are 14,50 and 15. Above these space opens to 17 target.
I do not send this post to Twitter, as there I already called your attention hours ago.
Good luck, and God bless the Japanese chart techniques! :-)


Largest H&S pattern of the century?Sugar now retreating to the ascending .105 support level.
Will this complete the head and shoulders pattern for a huge flush or bust?

!SUGARUSD Buy Position!Every crossover is targeted, no particular news that would affect sugars price. Because of the time of season for sugar the prices will increase due to growing seasons.
---------------------------------------------
CTF - SUGARUSD
Chart timeframe - 4hr
Area of interest - 1.4 , 1.8
Potential target 1 - 1.55
Potential target 2 - 1.675
Potential extended target - 1.75
---------------------------------------------
Trade Safe everyone!

Looks I need some sugar for coffee :D Soft Commodities looking for longer term investment, as $ as weakening is great opportunity.

Sugar looking sweet on the DailySideways head and shoulders pattern developing. Ideally, we see a retracement into dashed line below 1370 but looks like we're about to breakout.

HEAD AND SHOULDERS PATTERNWe have possible inv head and shoulders pattern in development on daily timeframe.
It would be a good idea to entry after breakout of necklinme and aim at least to targets as maked on chart.


Something to watch- Ichimoku setup is bearish, as Price managed to climb back to Kumo, after testing very important long term horizontal key resistance at 12,55+. Now Price is located between Tenkan and Kijun lines (above Kijun), while Tenkna/Kijun is in weak bullish cross.
- Heikin-Ashi turned bearish after test of Kumo and 100wma.
- EWO is bullish. MACD is neutral
- Upper key level for this market is clearly 14,55.
What do we have to watch now? As EWO is in bullish territory and Price is above Kijun Sen, we have to see what Sugar will do if it drops to Kijun, which is the short term lower key level now at 13,59.
If we see a possible momentum reversal or a clear buy signal there, then we can enter maximum 1 risk unit long position. Bigger size long only above 14,55.
Remember! You do not buy automatically at Kijun, as market may wash through it to the downside. Just because Price is above it now, it doesn't necessarely mean it will stay above it. You buy only, when there is a bullish signal at the *possible* support.
