SUGARUSD trade ideas

Sugar looks ripe for a correction.Candlesticks pattern looks like bulls' exhaustion here.
Looking at the weekly chart prices are confronting the alignment of Kijun and SSB flats extension.

Im calling this the top. We're going up with decreasing volume. Might see a lower low this time if we start breakingdown from here! Do not let this consolidation fool you


Sugar (SUGAR/USD) Daily Chart Analysis 10/18Technical Analysis and Outlook
Sugar closed at $1281 on Wednesday busting though Key Resistance $1268 . Prices are closing nearer the Sugar Rally $1327 each trading day. Profit taking may pull down the soft commodity to Mean Support $1236 following striking a four-month high $1302 today. The bulls hold the over-all near-term technical edge, since the prices are in a steep uptrend, as awaiting Sugar Rally $1327 will be struck any day.

Sugar (SUGAR/USD) Daily Chart Analysis 10/13Technical Analysis and Outlook
The Sugar finished higher for the second consecutive day with the completion of Sugar Rally $0.1232 in play since flagged by Trade selector Signal on Oct 1, as the commodity consolidates much higher range journey.
The stage for transforming from bullish by completing the move is signaling down prices are likely to occur in near term, with first Mean Support resting at $0.1194 , while very significant the Mean Support lies at $0.1116 . On the upside, there is major Key Resistance $0.1268 .


Sugar Will Be Bullish Soon - All Times Low (after 2008)When you look at SUGARUSD weekly chart, price action is at 10 year lows now but still showing red. I believe that 0.09850 will be turn around soon (this month), then bullish trading for rest of year back to 0.13370 area. Consertive traders will wait for break of red trend line above current price action, if you are agrresive then look at daily and or hourly charts for entry signals to trade bullish.


Sugar (SUGAR/USD) Daily Chart Analysis 10/1Commodity Analysis, Implications and Outlook
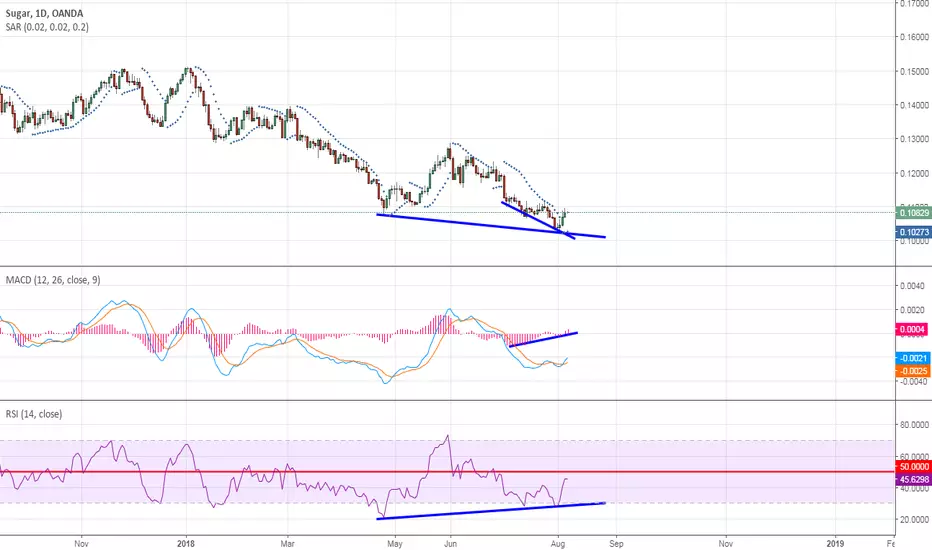
Sugar currently is stuck in a multi-year downtrend. Nevertheless, the decline to the long-term outer Sugar Dip $0.08955 area produces the potential for short to medium term bullish action. Following this bounce, we expect to see the Sugar market to continue the downtrend right up until extends to its historic new support.
Except for a strong bullish move, we predict Sugar to rally to the Key Resistance $0.108 4. At this stage, bears will more than likely declare their dominance and protect the downtrend resistance. The touch of the Key Resistance will set off the resumption of the downtrend...More


The sugar looks sweetOur sweet friend looks very good, both short and long term, I will see how this movement works.
It only remains to check how it looks from the fundamental point of view.
Best wishes to all!!


Long Sugar - just finished 5 wave bear?On the daily chart I think sugar is coming off a 5 wave bear and starting a new trend. I'm watching the 1hr and 3hr timeframes and tomorrow will check for confirmation on upward swing in momentum. If it's there, I'm going long.

testing support again1st support at 11, then 104, then a long term support level at around 094. indicators oversold

testing support again1st support at 11, then 104, then a long term support level at around 094. indicators oversold

Suger 11 is @ bottom Hi Traders,
Suger N°11 is at the bottom,
I expect, that it will be high retourn on this trade,
Respect your money managment
Best luck
Omar


Buy SugarSugar Buy because
a) Bullish Divergence
b) Wave 2 completed at 61.8%
c) Wave 3 started
Long term hold for explosive profits

Sugar warming up!!!Sugar got rejected at weekly resistance initially. Price is possibly forming higher low. Looking for buy signal here for a move to 0.1500.
