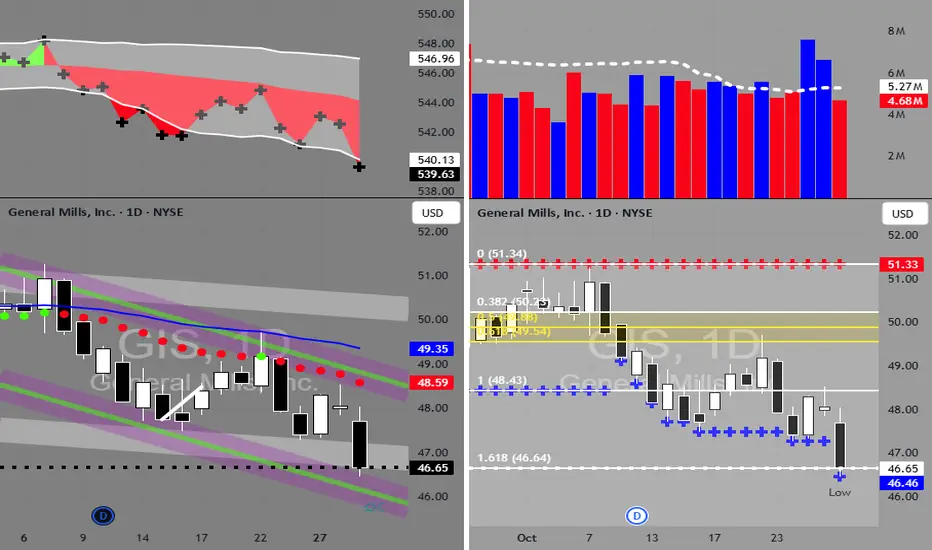
GIS in BUY ZONEMy trading plan is very simple.
I buy or sell when either of these events happen:
* Price tags the top or bottom of parallel channel zones
* Money flow volume spikes beyond it's Bollinger Bands
So...
Here's why I'm picking this symbol to do the thing.
Price in buying zone at bottom of channels
M
Next report date
—
Report period
—
EPS estimate
—
Revenue estimate
—
4.540 EUR
2.01 B EUR
17.18 B EUR
531.30 M
About General Mills, Inc.
Sector
Industry
CEO
Jeffrey L. Harmening
Website
Headquarters
Minneapolis
Founded
1928
ISIN
US3703341046
FIGI
BBG000D79WB7
General Mills, Inc. engages in the manufacture and marketing of branded consumer foods sold through retail stores. Its product categories include snacks, ready-to-eat cereal, convenient meals, pet food, refrigerated and frozen dough, baking mixes and ingredients, yogurt, and ice cream. It operates through the following segments: North America Retail, International, North America Pet, and North America Foodservice. The North America Retail segment includes grocery stores, mass merchandisers, membership stores, natural food chains, drug, dollar and discount chains, convenience stores, and e-commerce grocery providers. The International segment refers to the retail and foodservice businesses outside of the US and Canada. The North America Pet segment includes pet food products sold in national pet superstore chains, e-commerce retailers, grocery stores, regional pet store chains, mass merchandisers, and veterinary clinics and hospitals. The North America Foodservice segment offers ready-to-eat cereals, snacks, refrigerated yogurt, frozen meals, unbaked and fully baked frozen dough products, baking mixes, and bakery flour. The company was founded by Cadwallader C. Washburn on June 20, 1928 and is headquartered in Minneapolis, MN.
Related stocks
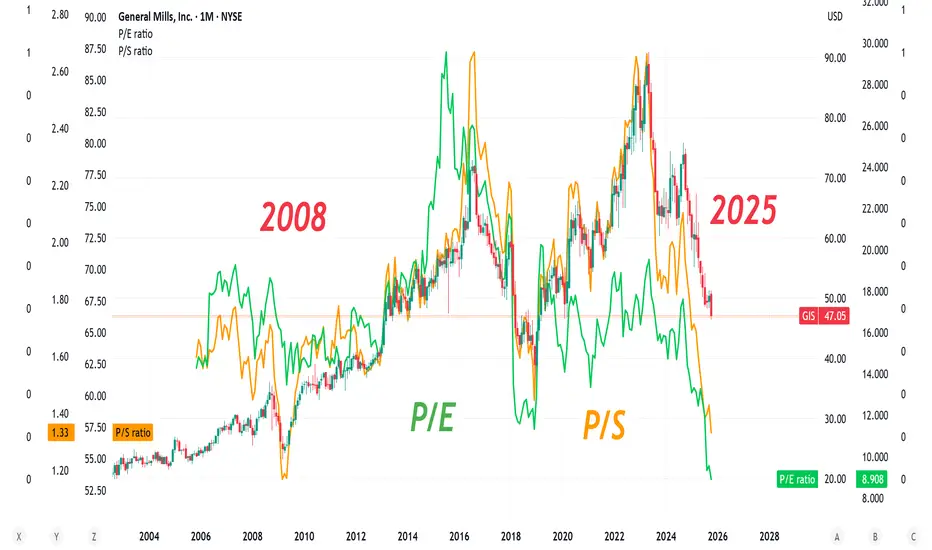
General Mills "GIS" Cool print on P/E & P/S (lowest since2008)" A P/E ratio, or price-to-earnings ratio, is a financial metric that shows a company's share price relative to its earnings per share (EPS). It indicates how much investors are willing to pay for each dollar of a company's earnings, helping to assess if a stock is overvalued, undervalued, or fairly
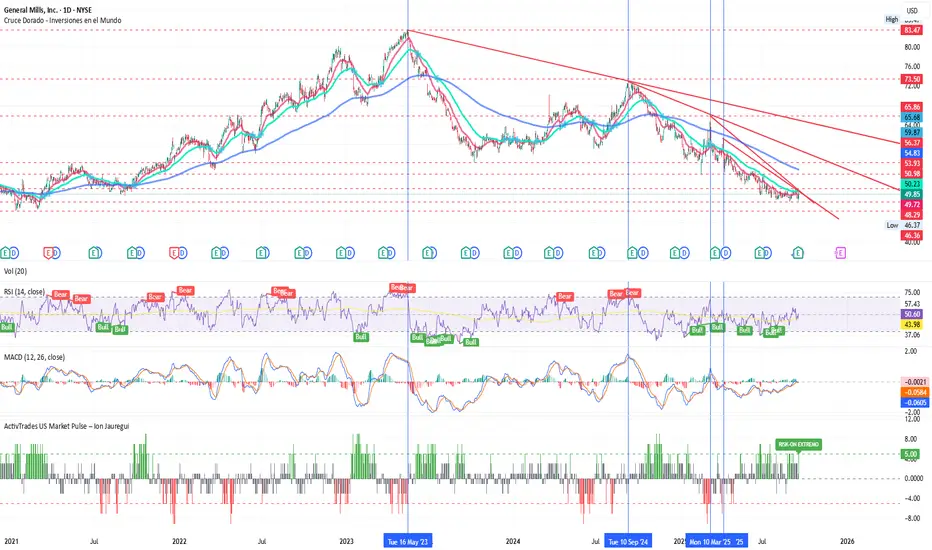
General Mills Holds Firm in a Challenging EnvironmentBy Ion Jauregui – Analyst at ActivTrades
General Mills (Ticker AT: GIS.US), one of the U.S. food industry giants, has reported results that show resilience despite difficulties in its main market. In North America, where much of its business is concentrated, volumes declined by 16 percentage poi
GIS Ascending Broadening Wedge SetupGIS has a strong wedge setup here. Looking at previous trends, price has bounced off the Lower Trendline twice in the past. GIS could be due for yet another bounce off the Lower Trendline. I will watch around that $48-$40 range for a possible breakout, especially with earnings coming up.
Based on

GenneralMills Earnings play —$50C Don’t miss outGIS Earnings Analysis Summary (2025-09-16)
Summary (quick take)
Consensus from the model set: mixed. Two models (Gemini, Llama) favor buying the $50 call around $0.85 into earnings; two models (Grok, DeepSeek) either prefer puts or no-trade; Claude is neutral/no-trade. The single highest‑probability

GENERAL MILLS - GIS - MY PROBLEM WITH FRACTALS - EDUCATIONAL... The Markets are definitly fractal.
But at the moment I can't decide...
Maybe someone can help me out?
All in all GIS dropped a huge lot and might present a good entry price for a medium to long term investor / trader...
General Mills - Legendary Recession StockWe could be witnessing the biggest correction in General Mills history, again! For the 2nd time in 5 years! I trust in the golden fib, volume looks good, and RSI is low. If it makes it to the top of the channel it'll double in price in the coming years. This looks like a good candidate for Elliott W
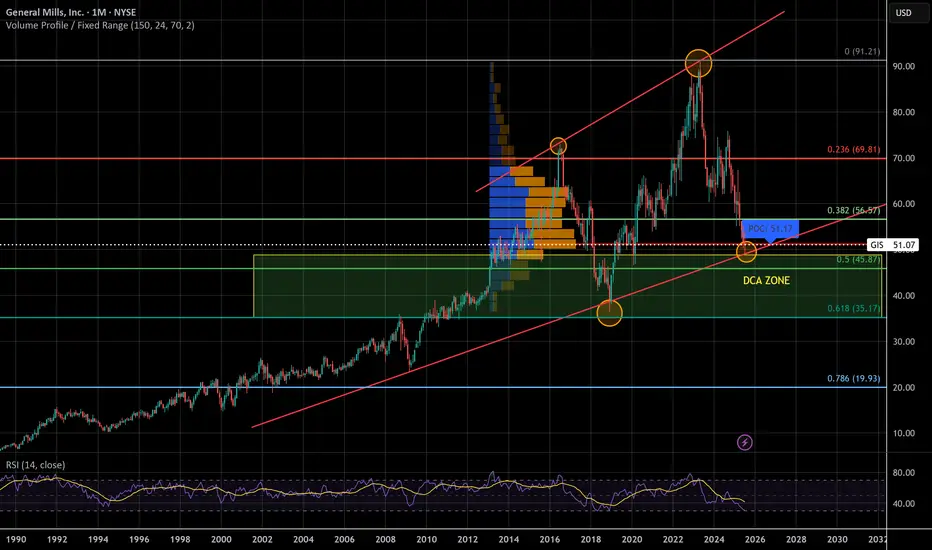
GIS to $100 by 2030?Looking at the previous chart patterns and RSI indicator, I am going to be looking for a reversal around the $55.00 level.
This could be a great opportunity to get into a long term position with huge upside potential.
The RSI looks very similar now, to how it did in December of 2018 when it went

GIS Bullish Breakout – Eyes on $55.33! 📈
🧠 Trade Idea Summary:
Ticker: NYSE:GIS (General Mills Inc.)
Trade Type: Long
Chart: 15-minute
Setup: Bullish wedge breakout + volume support
Entry Zone: $54.00 (breakout level)
Stop Loss: $53.59 (below wedge support)
Target 1: $54.57 (resistance zone)
Target 2: $55.33 (gap fill / higher

#GIS - Time to make money - 51 is the key ?!waiting price around 51
way ?
activate 2 bullish patterns for targets on the chart
but don't forget (( stop loss )) will be 49.60
Its not an advice for investing only my vision according to the data on chart
Please consult your account manager before investing
Thanks and good luck

See all ideas
Summarizing what the indicators are suggesting.
Neutral
SellBuy
Strong sellStrong buy
Strong sellSellNeutralBuyStrong buy
Neutral
SellBuy
Strong sellStrong buy
Strong sellSellNeutralBuyStrong buy
Neutral
SellBuy
Strong sellStrong buy
Strong sellSellNeutralBuyStrong buy
An aggregate view of professional's ratings.
Neutral
SellBuy
Strong sellStrong buy
Strong sellSellNeutralBuyStrong buy
Neutral
SellBuy
Strong sellStrong buy
Strong sellSellNeutralBuyStrong buy
Neutral
SellBuy
Strong sellStrong buy
Strong sellSellNeutralBuyStrong buy
Displays a symbol's price movements over previous years to identify recurring trends.
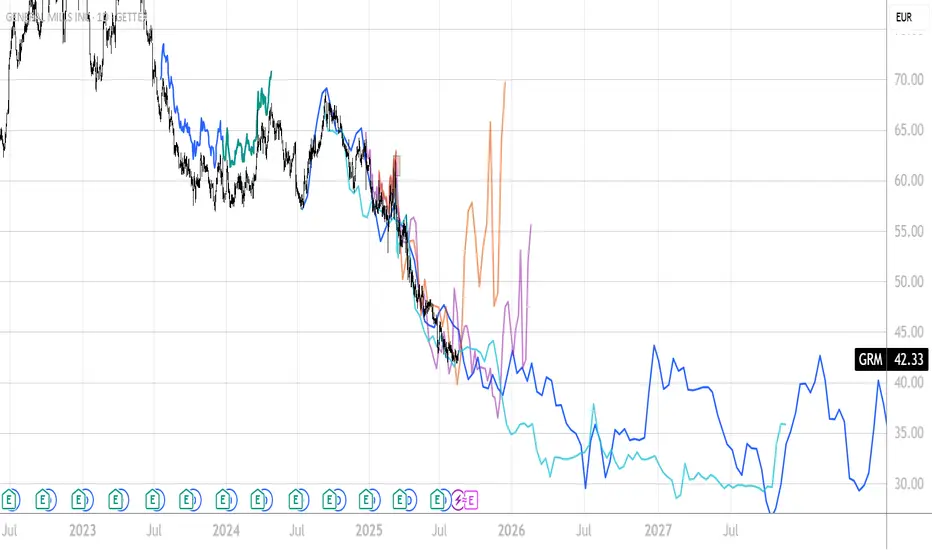
GRMJ
General Mills, Inc. 4.7% 17-APR-2048Yield to maturity
5.67%
Maturity date
Apr 17, 2048
GIS3962421
General Mills, Inc. 4.15% 15-FEB-2043Yield to maturity
5.65%
Maturity date
Feb 15, 2043
GIS5334463
General Mills, Inc. 3.0% 01-FEB-2051Yield to maturity
5.60%
Maturity date
Feb 1, 2051
GIS.JQ
General Mills, Inc. 5.4% 15-JUN-2040Yield to maturity
5.31%
Maturity date
Jun 15, 2040
US370334CH5
General Mills, Inc. 4.55% 17-APR-2038Yield to maturity
5.27%
Maturity date
Apr 17, 2038
GIS5943212
General Mills, Inc. 5.25% 30-JAN-2035Yield to maturity
4.96%
Maturity date
Jan 30, 2035
GIS5562214
General Mills, Inc. 4.95% 29-MAR-2033Yield to maturity
4.72%
Maturity date
Mar 29, 2033
GIS4972815
General Mills, Inc. 2.875% 15-APR-2030Yield to maturity
4.24%
Maturity date
Apr 15, 2030
GIS5942926
General Mills, Inc. 4.875% 30-JAN-2030Yield to maturity
4.23%
Maturity date
Jan 30, 2030
GIS5666973
General Mills, Inc. 5.5% 17-OCT-2028Yield to maturity
4.11%
Maturity date
Oct 17, 2028
GRMH
General Mills, Inc. 4.2% 17-APR-2028Yield to maturity
4.09%
Maturity date
Apr 17, 2028
See all GRM bonds
Curated watchlists where GRM is featured.


Frequently Asked Questions
The current price of GRM is 41.395 EUR — it has decreased by −0.01% in the past 24 hours. Watch General Mills, Inc. stock price performance more closely on the chart.
Depending on the exchange, the stock ticker may vary. For instance, on SWB exchange General Mills, Inc. stocks are traded under the ticker GRM.
GRM stock has risen by 2.00% compared to the previous week, the month change is a −1.15% fall, over the last year General Mills, Inc. has showed a −31.45% decrease.
We've gathered analysts' opinions on General Mills, Inc. future price: according to them, GRM price has a max estimate of 54.41 EUR and a min estimate of 39.73 EUR. Watch GRM chart and read a more detailed General Mills, Inc. stock forecast: see what analysts think of General Mills, Inc. and suggest that you do with its stocks.
GRM stock is 0.01% volatile and has beta coefficient of 0.09. Track General Mills, Inc. stock price on the chart and check out the list of the most volatile stocks — is General Mills, Inc. there?
Today General Mills, Inc. has the market capitalization of 22.12 B, it has increased by 0.39% over the last week.
Yes, you can track General Mills, Inc. financials in yearly and quarterly reports right on TradingView.
General Mills, Inc. is going to release the next earnings report on Dec 17, 2025. Keep track of upcoming events with our Earnings Calendar.
GRM earnings for the last quarter are 0.74 EUR per share, whereas the estimation was 0.70 EUR resulting in a 5.08% surprise. The estimated earnings for the next quarter are 0.89 EUR per share. See more details about General Mills, Inc. earnings.
General Mills, Inc. revenue for the last quarter amounts to 3.87 B EUR, despite the estimated figure of 3.88 B EUR. In the next quarter, revenue is expected to reach 4.15 B EUR.
GRM net income for the last quarter is 1.03 B EUR, while the quarter before that showed 249.89 M EUR of net income which accounts for 312.49% change. Track more General Mills, Inc. financial stats to get the full picture.
Yes, GRM dividends are paid quarterly. The last dividend per share was 0.53 EUR. As of today, Dividend Yield (TTM)% is 5.06%. Tracking General Mills, Inc. dividends might help you take more informed decisions.
General Mills, Inc. dividend yield was 4.50% in 2024, and payout ratio reached 58.56%. The year before the numbers were 3.46% and 54.78% correspondingly. See high-dividend stocks and find more opportunities for your portfolio.
As of Nov 22, 2025, the company has 33 K employees. See our rating of the largest employees — is General Mills, Inc. on this list?
EBITDA measures a company's operating performance, its growth signifies an improvement in the efficiency of a company. General Mills, Inc. EBITDA is 3.18 B EUR, and current EBITDA margin is 19.70%. See more stats in General Mills, Inc. financial statements.
Like other stocks, GRM shares are traded on stock exchanges, e.g. Nasdaq, Nyse, Euronext, and the easiest way to buy them is through an online stock broker. To do this, you need to open an account and follow a broker's procedures, then start trading. You can trade General Mills, Inc. stock right from TradingView charts — choose your broker and connect to your account.
Investing in stocks requires a comprehensive research: you should carefully study all the available data, e.g. company's financials, related news, and its technical analysis. So General Mills, Inc. technincal analysis shows the neutral today, and its 1 week rating is sell. Since market conditions are prone to changes, it's worth looking a bit further into the future — according to the 1 month rating General Mills, Inc. stock shows the sell signal. See more of General Mills, Inc. technicals for a more comprehensive analysis.
If you're still not sure, try looking for inspiration in our curated watchlists.
If you're still not sure, try looking for inspiration in our curated watchlists.