SPY WEEKLY JUNE 17 2024SPY weekly is here. If you have any doubts make sure to DM me here. All the crucial levels have been discussed in this analysis.
NOTE: MARKET IS BULLISH & RETRACEMENT CAN COME
1557 trade ideas

SPY, QQQ & NVDA: Week of June 17Hey everyone,
Wasn't in the mood to type, so here is my analysis in video format!
Hope you enjoy and as always, feel free to leave your questions below :).
Safe trades!

Spy Spy Is expected to make one of the biggest moves of the whole year Tomorrow, be very careful with tomorrow moves will keep everyone posted!!!

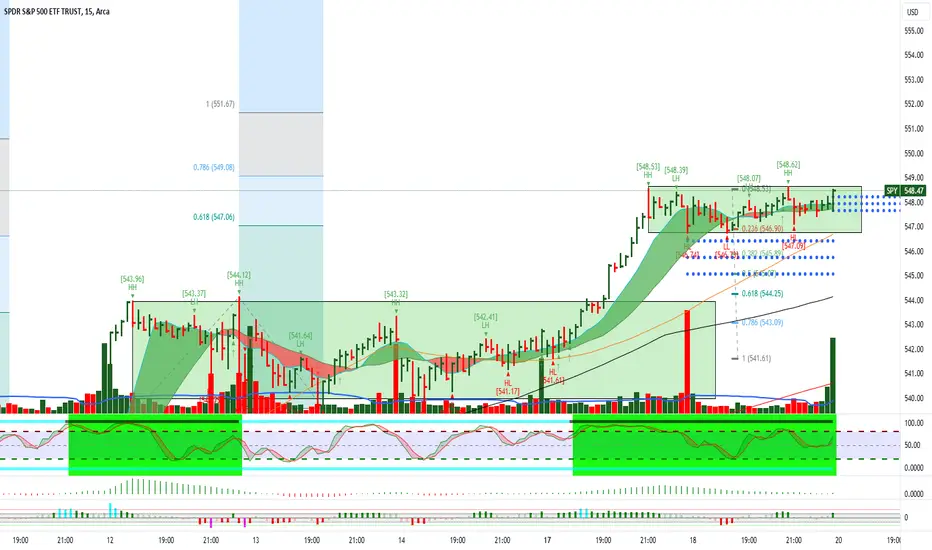
$SPY June 19, 2024AMEX:SPY June 19, 2024
15 Minutes.
Holding 547 AMEX:SPY is aiming for 550-551.5 as next target. Last support for this uptrend is 544 levels which is 61.8% retracement for the last rise as marked.
I spy $600Hi everyone - I wanted to make a quick post with my thoughts on the next moves for AMEX:SPY using Elliott Wave Theory and Fibonacci Price/Time levels. I’m on my phone so I apologize if the chart screenshot looks cluttered.
AMEX:SPY is currently in a Primary W5 that should conclude in August. Yesterday we saw a spike after CPI came in cooler than expected, which completed the Minor W5/Intermediate W3 at $542.46.
The market also received disappointing news that the fed is only planning on one rate cut this year. This type of news bolsters the argument that we are entering an Intermediate W4.
I do not think this wave will last long and it could be choppy since Intermediate W2 saw a sharp move down after the extended W1. I will not go short on this trade and will wait to go long near the bottom of the channel ($530) around June 24th. As you can see on the volume profile, there is significant buying pressure at this level which will propel us into Intermediate W5.
The fifth wave will need to reach the Primary 1.618 price level and Primary 1.618 fib time marker. These levels cross on August 6th at $594. I think there will be psychological pressure to hit $600 since we’ll be in a PW5/IW5/MW5 wave. From there, I predict we enter a bear market that could also carry a negative news catalyst.
If the bear market is primarily technical without fundamental support, I predict the market will pick back up next year.

$SPY June 13, 2024AMEX:SPY June 13, 2024
15 Minutes.
AMEX:SPY as target 544+ levels with gap up.
I had no trade.
Officially AMEX:SPY in buy zone for a long term. Holding 490-495 levels, once AMEX:SPY crosses 550 levels I have multiple targets up to 640 levels.
Hence uptrend confirmed in daily. No more shorts until trend change in daily.
in 15 minutes, we gave one problem bar. It made all time high and closed near low too, 54412 to 540.98.
As moving averages are away, I see consolidation.
I always believed gaps are good and movement is string if gaps not filled.
So, considering the rise 532.04 to 544.12 i see a risk to reward entry only around 538 levels for the day.
Now long only above 544.5, provided close of bar is good in 15 minutes.
If I get my price, I will go long 538 - 539 levels for 546-548 as target.
Taking 518.36 as low for the move 518.39 to 536.9 to 532.04 we can see $ SPY has achieved 61.8% of extension. Hence, I expect next levels to be in range 544-551.
In 15 minutes for the move 532.04 to 544.12 to 537-538 (my retracement levels for the day) we have 546 as 78.6% extension and 548-549 as 100% extension.
Hence my target now 546-548.
I miss lots of trades due to gaps.
Need to sort out that issue.

SPY: Bearish Continuation
Remember that we can not, and should not impose our will on the market but rather listen to its whims and make profit by following it. And thus shall be done today on the SPY pair which is likely to be pushed down by the bears so we will sell!
❤️ Please, support our work with like & comment! ❤️

SPY Summer PullbackThe recent low levels of liquidity may become more prevalent moving into the summer time as vacation time for many nears.
I am also waiting to hear the decision from the Bank Of Canada as well as other major banks around the world about the start of quantitative easing and lowering interest rates as soon as June.
The only problem with this, is the increasing value of the USD/DXY which may begin to strengthen against other currencies whom begin their devaluation.
Because the markets are generally measured relative to the dollar, a stronger DXY may provide the market with some downside in the summer months.
We do have some gaps (inefficiency) below at approx. 505-510 on the SPY. Interestingly or not , the golden 0.618 golden fib overlaps perfectly in these potential support zones.
I do not quite see the larger probability of a major market crash during an election year at the moment, and the longer term trend is still bullish.
Lets see how things play out


SpyLooking a test of the 20sma this week. Lots of support near 528-530..
I'll list then here
1. 20/21 Ema - 528
2. Trendline - 530
3. Gap close support 528
They could dip this to 526 to trap some bears but unless it closes below 525 I wouldn't linger short.
The only reason I'm leaning towards 540 is because of the Dow and XLY sector.. dow wants 40k again in my opinion. And XLY (Amzn& Tsla) looks prime for a pennant breakout.
Since we are near the top of this wedge I'd say CPI and Maybe FOMC gets us to flush first to 529 then PPI the following day could get a rally back to resistance or 540..
IWM daily chart
Looks to be headed back to trendline support or 193-195, from there we'll either bounce or kick off a full bear reversal back to 170.. yellow trendline has been bulls cock blocker for the last week.
Dow jones daily chart
Look for a drop back near support in the coming days then a rip similar to what I circled.
Only bearish below 37,500
As far as tech goes .. pay close attention..
I think the leaders going forward will no longer be chips.. here's 2 major chip sectors SMH, SOXX.
SMH daily chart (Log scale)
Top of channel, both channels
Zoom in
Here's Soxx
Daily chart similar setup as SMH
Zoomed in
I think this next pump this week will be the last before a major correction.. After AVGO earnings this week we will see.
Now here's XLY
Bullish pennant here that either amzn or tsla (Or both) will benefit from. I think we breakout this week.
Qqq daily chart..
Grinding against white trendline resistance..
Look for a pullback to 454 this week, that's as lows I'd take it.. below that and 450 is next.. if we bounce at 454 then 470 is incoming...
Bears only in control below 447.
Summer months usually have low volume so expect 1 or 2 big moves a weeks depending on economic news then chop for most days.
Got your messages in my inbox. I won't be active here as much this month and I'll be gone after this month.. Glad to have helped, taught, and explained whenever I could.

SPY: Week of June 10th And I'm back.
Sunburned to all h3ll. haha
For next week on SPY, its looking bearish initially. We do have a reference target at 533 so expect a retrace to this area.
Looking for 529 and ideally we break below to head to those low targets, because that will test this wedge SPY is making.
Here is the wedge from a daily perspective:
And the weekly:
Probs on SPX and NDX are particularly bearish which gives the most reliable assessments. SPY is meh. Loosy goosy essentially.
We fell below the threshold range in afterhours on Friday.
We left off with a setup that brings SPY down to 531, so potential gap down situaiton.
If its going to sell, I would like to see it sell right away and quickly to rebound back up.
If we hit those low targets you're pretty golden to long and just hold long because of this:
Key points to remember for next week:
1. Trend support rests within the lower low targets (the red box in the chart).
2. Reference target of 533 which is hit roughly 80% of the time, meaning that if we see a fast sell, we will likely see an equally fast rebound.
3. We are still midway into the wedge, its not likely we see a big breakdown here. We do have some catalysts, NVDA split (bearish), FOMC (neutral). These may be catalysts enough to bring us down to the trend support but they aren't going to likely cause a break down or out one way or the other.
Cavet: If we go up first, which is a possibility, then we look for rejection at the top of the range in the chart. Going up first doesn't make sense when you look at the math levels/predictions. Its a cleaner setup to go down first and snag the math low estimates and the trend support. But, if the market wants to shake things up (it really hasn't shaken things up in a very long time, its been pretty stable lately, but there is always a first), then we could technically go up first. This wouldn't necessarily change the bearish re-test but it would complicate the reversal point.
Overall bias remains, shocker, bullish.
Safe trades everyone!

Plan Your Trades - SPY Research For 6/17 & BeyondI put together this video to help traders plan and prepare for the next 30-60+ days - as we move into Q2:2024 earnings and pre-election consolidation.
Every week, I spent hours going over my Custom Indexes, proprietary price modeling systems, sector analysis, and more. My goal is to help as many traders as possible prepare for the greatest opportunities of their life (the next 5 to 10+ years).
I see so many traders getting trapped into following free or paid internet advice and blowing up their accounts. In my opinion, stick to the basics. Price is the ultimate indicator.
Then, determine the true bias of price trend and identify strong candidates to profit within that trend.
If you are a daytrader - you probably won't like my research/comments. I don't really daytrade much. I'm more of a swing trader - looking for 8% to 25% swings that take 3 to 20+ weeks to mature.
Either way, this video will help you understand what to expect over the next 30-60+ days in the US/global markets. Prepare for a big move in late June or early July.

Below 540.44 gets exciting SPY looking bearish. Could see the floor drop if it dips below 540 ish. Selling calls here.

$SPY range $479-$529, the path to the top (and bear market)AMEX:SPY looks to be showing signs of weakness here. Thinking that we could see the first large decline of the year into one of the support levels below $479-$495. Breaking the trend line would be the trigger.
If that happens and we do get a low, then I think we'll have one final rally to the upper resistance levels between $525-$530.
Another possibility, is we just continue upwards to the top resistance levels and then decline after. Idea of a range is you want to buy the lows (supports on chart) and sell the highs (resistances chart).
Regardless of the path we take, we're nearing a top in the market and after we hit those top levels, I expect a large decline lower (one that takes us past the prior 2022 lows).
Ultimately looking for SPY to reach the $280-300 level by the end of 2024. But let's save that analysis after we see what happens in this range.

SPY Weekly OutlookMany of you are confused on the recent price action of the market.
When in doubt, zoom out.
Pay attention to the next fib level and pay attention to GOLD & OIL.
Feds only cut rates during market turmoil not during bull runs.
To keep it SHORT and sweet. It doesn't end well for risk assets.
On the other hand, have you seen the prices of cocoa??? Insane!

$SPY Puts IDEA 6/13 #GapFill #DoubleTopCheap idea... Multiple techinicals pointing this down.. however i give little to non daily candle plays... but thought this was worth a shout out
- Proph
Always with the juice.... man
536p 6/13 @ .35
COME PICK UP THOSE WHO WERE LATE TO THE BULL MARKET!!! ;p

$SPY & CRE PanicIgnoring mainstream news and whatever and only using my data i'm seeing that CRE is experiencing unknown trouble. While SPY and other indices have been pumping possibly thanks to NVDA, CRE has been experiencing big trouble.
I think CRE trouble may spill over to the rest of the market as some kind of SVB/SIVB-like event sometime soon e.g June/July and will end at the start-mid August.
In my data below there's a big gap between SPY & CRE. When this gap first started forming, SPY did follow CRE data downwards but then got saved by... i dunno NVDA, the rest of the market... no idea. imgur.com
Point is the gap still exists and gaps are always fulfilled by being closed off one way or another.
"In a deep pub Clive British voice": I recon SPY goes down soon.
There's a chance we triple top on SPY before anything actually happens e.g we visit $523, then back up to $535, then after some consolidation finally break downwards to the $465's area. Actually hoping we this current double top resolves starting now and we do a quick visit to $465 before rebounding back upwards.
Thanks for attending this Ted talk.

SPY short hunt is back onI will set an alert at the low of the last two days. At that point of the days internals look soft I will take a beginner level starter put position. The intent is to risk a small amount of $ to try and catch a day trade that I even still want to hold by the end of the day.
Alert at 532.50

$SPY Target near Apex.Updating Levels as we got ways to go before we see $600
AMEX:SPY
return of hyper inflation will we see
AMEX:SPY
my high target of $640.30 or will it die off around $540.70 give or take after we reach those highs we will see pullback back down to $395 if buyers fail to step up to show support we'll be testing 2008 lows back around $285 eventually down to $200 then $86 then $24 (WW3 scenario / end of world scenario/ near default)
As bears we've done our job to short squeeze it to highs as news hit about Trump wall st bought up the rumors let's see how long we'll extend the rally.
Thinking we got a bit more to go before we short completely after the rate cuts come around fall time you'll see a mass sell off as banks shut down.

SPY ETF Analysis: Patience is KeyCurrently, the SPY ETF shows an upward trend in both the long and short term, without clear signs of weakness. The current short-term trend leg seems strong enough to reach higher targets, especially due to the lack of significant resistances, except for round numbers that act as psychological barriers. However, we must consider the maturity of this trend. Prolonged trends can be vulnerable to corrections, which might threaten the continuity of the current rise. Moreover, the overall market scenario is not entirely favorable, with other important ETFs like QQQ, DIA, and IWM showing mixed signals. For instance, the DIA is showing weakness and might be starting a reversal, while the IWM is no longer in an uptrend.
For those looking to buy, it's important to take minimal risks and aim for shorter targets since the trend, although still upward, has reached a dangerous stage. Holding large positions or expecting prolonged movements may not be wise at this moment. Any sign of weakness, such as the current short-term trend leg failing to reach higher targets, should be a reason to exit positions or reduce exposure. On the other hand, for those thinking of selling or taking advantage of a possible decline, it’s prudent to wait for the first signs of weakness in the uptrend before starting to build positions, keeping them light and taking more risk only when there is a confirmed trend change. In conclusion, patience and caution are essential now. It’s better to avoid medium trades and focus on low-risk positions until the market shows clearer direction signals. Better opportunities will come, so stay calm and avoid significant risks.
What do you think of this analysis? Leave your comment below and share your perspectives on SPY!

SPY Set To Fall! SELL!
My dear followers,
This is my opinion on the SPY next move:
The asset is approaching an important pivot point 542.74
Bias - Bearish
Safe Stop Loss - 549.46
Technical Indicators: Supper Trend generates a clear short signal while Pivot Point HL is currently determining the overall Bearish trend of the market.
Goal - 530.66
About Used Indicators:
For more efficient signals, super-trend is used in combination with other indicators like Pivot Points.
———————————
WISH YOU ALL LUCK

Market Crash - Weekly Recap & Expectations for Next WeekThe market crash did not start this week unfortunately for me and my puts, but I still have confidence in the setup. I believe we're seeing a large divergence between NQ, ES and the rest of the market, which will eventually correct, it's just hard to say when. I know many are bullish due to the election year and other things, but I remain firm in my stance that we are near the top, even if we rally throughout the summer. We'll see how it goes, I made some short term bets this week that didn't work, but I'm optimistic about the short in the longer term.

SPY: Daily and Weekly Chart InsightsDaily Chart: Ascending Channel and Key Breakout
The daily chart of the SPY shows a robust upward trend within an ascending channel. The price has been making higher highs and higher lows, respecting the channel's boundaries. Key levels include the lower boundary of the channel as dynamic support and the 21-day EMA as a critical support level. Recently, SPY broke above the previous top at 533.07, suggesting a continuation of the bullish trend. Only if the SPY loses the 21-day EMA and this $533.07 support we would see a mid-term pullback. If the price continues to respect the ascending channel, it could reach higher resistance levels around 560.
Weekly Chart: Bullish Momentum and Support Levels
The weekly chart highlights a strong bullish trend with consistent higher highs and higher lows. The price is well-supported by the 21-week EMA. Key support levels include the 21-week EMA and the previous swing low at 524.11. The recent break above previous highs around 533 indicates sustained buying interest. If the bullish momentum continues, SPY could move towards the 550-560 range. However, a break below the 21-week EMA might signal a potential correction, with the next support around 500-510.
Conclusion: Strong Bullish Momentum with Clear Support and Resistance
Both the daily and weekly charts of SPY indicate a strong bullish trend within an ascending channel. The recent breakout above the previous top at 533.07 on the daily chart and the consistent higher highs and higher lows on the weekly chart suggest that the bullish momentum is likely to continue.
Key support levels to watch are the 21-day EMA at 534.43 and the lower boundary of the ascending channel on the daily chart, as well as the 21-week EMA at 514.79 on the weekly chart. Resistance levels include the upper boundary of the ascending channel and the psychological levels around 550-560.
Overall, SPY appears poised for further gains as long as it remains within the ascending channel and above the key support levels. We should monitor these levels closely for potential breakout or reversal signals.
For more detailed technical analyses and insights like this, be sure to follow my account. Your support helps me continue providing valuable content to help you make informed trading decisions.
Remember, real trading is reactive, not predictive, so let's stay focused on the key points described above and only trade when there is confirmation.
“To anticipate the market is to gamble. To be patient and react only when the market gives the signal is to speculate.” — Jesse Lauriston Livermore
