US10Y 3 - 3.2 By April 2026Short/mid term
Trillions of dollars are about to pour in from every Mag7/major trading partner, without issuing excess USD debt.
Rotation from public to private.
Trillions of excess going to be locked in on Tbills for collateral on building the next generation infrastructure.
Rate cuts to fund the small cap/robot/machine industry sprouting up.
Long term, you probably drop another handle as people look to secure profits from the boom.
Wild times ahead.
Buy Bitcoin
S&P
Russel
TSLA
not financial advice
US10Y trade ideas

Carry trade returnsThis you see here are the rates of change of the two yields. Not their levels, but the pace and direction in which they have been moving. Today the level of the spread is 2.5%, but at these rates of change, it will eventually invert.

United States – Japan 10-Year Yield SpreadThis you see here are the rates of change of the two yields. Not their levels, but the pace and direction in which they have been moving. Today the level of the spread is 2.5%, but at these rates of change, it will eventually invert.

US10YThe latest US JOLTS Job Openings report released at 3:00 pm shows current job openings at 7.18 million, which is lower than both the forecast (7.38 million) and previous reading (7.36 million).
Interpretation
This decline suggests some cooling in the US labor market, with fewer available positions compared to market expectations.
The lower-than-forecast reading may signal that businesses are becoming more cautious about hiring due to economic uncertainty or shifting demand.
The Federal Reserve will likely view this as a sign that labor market tightness is easing, which could reduce upward wage and inflationary pressures.
Implications for Markets and Fed Policy
Softer hiring demand could support arguments for maintaining or lowering interest rates if other economic indicators also point to weakening momentum.
Financial markets may interpret it as slightly dovish, expecting less urgency for Fed tightening.
This moderation in job openings adds to recent signals of a gradual slowdown in US employment dynamics.
THE NEXT UNITED STATE DATA REPORT WILL BE BY 1;30PM
ADP Non-Farm Employment Change: Forecasted at 73,000 jobs added, down from the previous 104,000, indicating a slowdown in private sector job growth.
Unemployment Claims: Forecasted at 230,000 initial claims, slightly higher than the previous 229,000, suggesting steady but slightly increasing weekly layoffs.
Revised Nonfarm Productivity (q/q): Forecast proposed to rise to 2.8%, up from 2.4%, showing improved labor efficiency in the second quarter.
Revised Unit Labor Costs (q/q): Forecasted to decrease to 1.2% from the prior 1.6%, indicating a potential easing in labor cost inflation pressures.
Trade Balance: Forecasted to widen to a deficit of -$77.7 billion compared to the previous -$60.2 billion, signaling increased import demand or weaker exports.
Final Services PMI: Slightly below expectations at 55.3 vs the previous 55.4, indicating continued expansion but at a marginally slower pace.
ISM Services PMI: Forecast to rise to 50.9, up from 50.1, signaling improved service sector growth and optimism.
These economic indicators collectively suggest a mixed picture: slower job growth and rising trade deficits but firm service sector expansion and improving productivity. This data is key for assessing US economic health and will influence Federal Reserve decision-making on interest rates and policy going forward.The latest US economic data forecasts and recent figures are as follows:
ADP(Automatic Data Processing, Inc.) (ADP); Non-Farm Employment Change forecast: 73,000 (previous: 104,000)
Weekly Unemployment Claims forecast: 230,000 (previous: 229,000)
Revised Nonfarm Productivity (q/q) forecast: 2.8% (previous: 2.4%)
Revised Unit Labor Costs (q/q) forecast: 1.2% (previous: 1.6%)
Trade Balance forecast: -77.7 billion USD (previous: -60.2 billion USD)
Final Services PMI forecast: 55.3 (previous: 55.4)
ISM Services PMI forecast: 50.9 (previous: 50.1)
These data points suggest a slowdown in employment growth, slightly increasing unemployment claims, increased productivity growth, easing labor cost pressures, widening trade deficit, and modest growth in service sectors. These indicators collectively will influence USD valuation and Federal Reserve policy outlook.
WATCH OUT FOR NEXT FOMC VOTING
#US10Y #DXY #DOLLAR
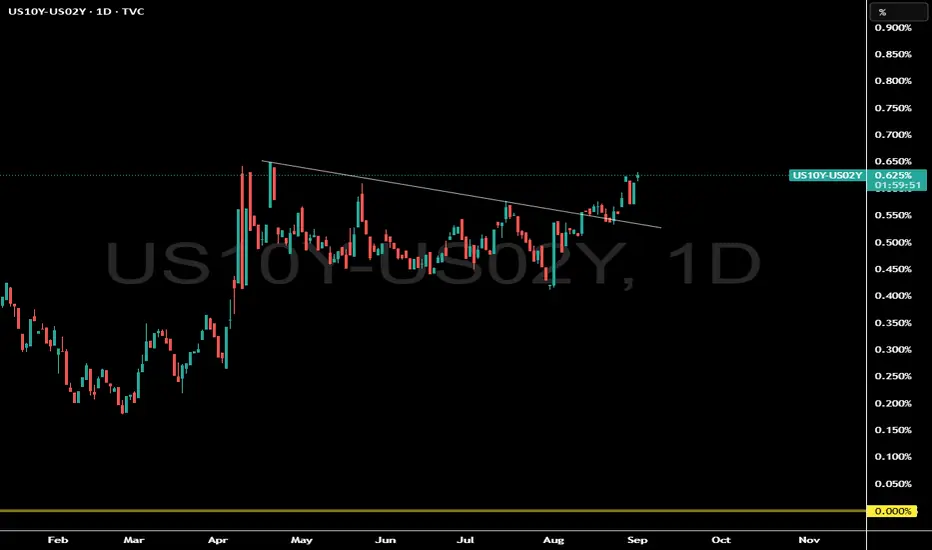
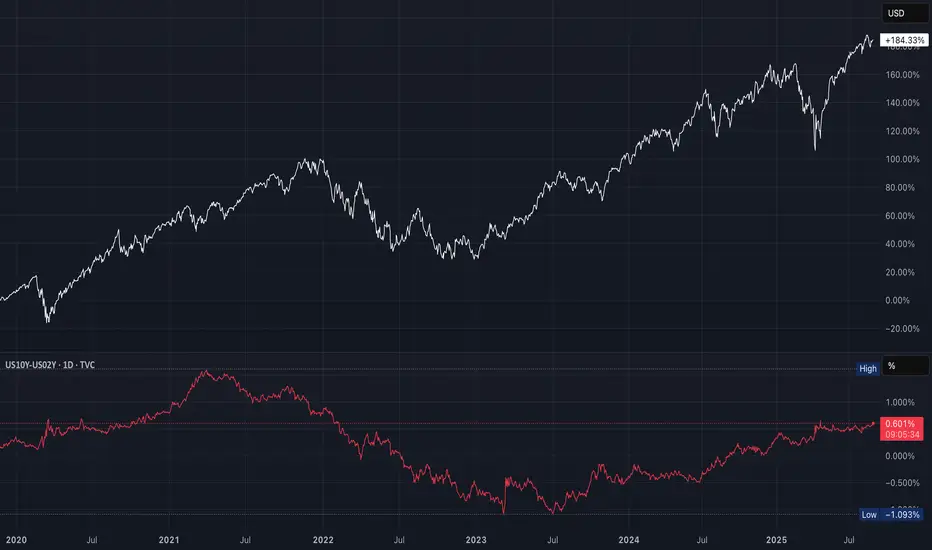
The Most Bullish Chart in the stock marketWhat does this 10 year yield and 2 year yield chart represent?
Is the bond market signaling a big economic event?
This bond market signal has a 100% success rate...but timing is the hard part since its a monthly long term signal.
Wait until we make a new pivot high in this chart...we should see some fireworks.
If you need to know what this means subscribe to our Youtube channel Where we often discuss macro economics and equites.
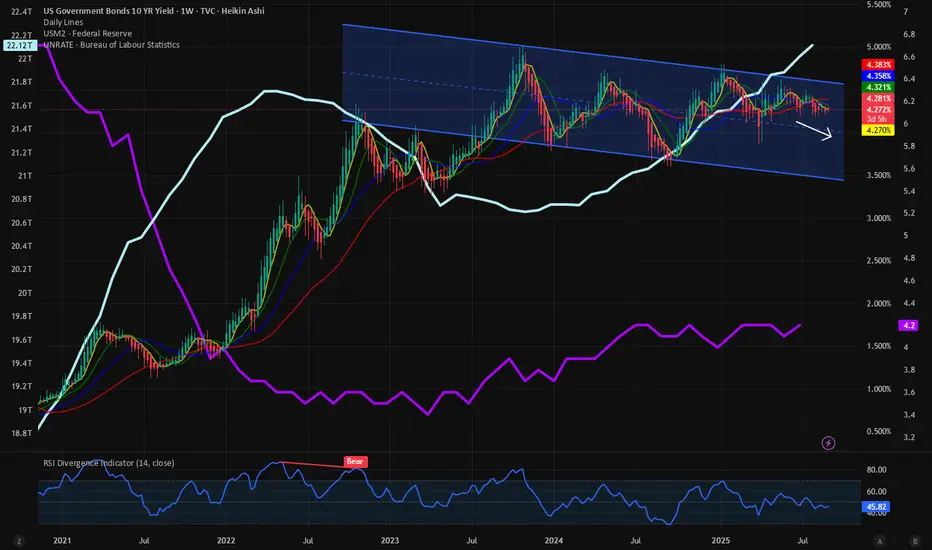
$USM2 at ATH. $US10Y rangebound. $UNRATE increasing. What's nextToday we dive deeper into the macroeconomic indicators. People who follow my space know my bias toward TVC:US10Y for market signals. Since months we are following the TVC:US10Y within this downward slopping parallel regression channel. On May 2 we predicted that we might see 3.5% by Dec 2025.
TVC:US10Y making new lows. 4% upcoming. 3.5% target low. for TVC:US10Y by RabishankarBiswal — TradingView
The target seems to be far-fetched with Fed staying put with the short-term interest rates. But what we did not observe is the ECONOMICS:USM2 increasing simultaneously. ECONOMICS:USM2 is the M2 money supply in the economy. This is increasing due to higher fiscal spending. This has resulted in fall in TVC:DXY and higher stock markets. At 22.1 T $ ECONOMICS:USM2 is above the Covid highs of 21.7 T $.
Despite of expanding fiscal spending the US Unemployment rate is increasing recently. With current rate of 4.21 % it is a multi-year high.
So as equity and Crypto investors what should we expect? In my opinion higher ECONOMICS:USM2 , rangebound TVC:US10Y and FRED:UNRATE < 5% we remain bullish. Higher ECONOMICS:USM2 , lower TVC:US10Y and FRED:UNRATE > 4.5% we get a small correction, but we buy the dip. Higher ECONOMICS:USM2 , TVC:US10Y < 3.5% and FRED:UNRATE > 5% we will be in recession, and we keep on buying Stocks and Crypto for bounce back.
Verdict: Macroeconomic indicators on poor footing. Whatever happens we buy Stocks and $BTC. Recession is just an opportunity to outsize portfolios.
The Future of Global Trading1. Historical Context and Present Landscape
Before looking into the future, it is important to understand the present state of global trading.
Globalization: Over the past three decades, globalization has integrated economies, allowing companies to source materials from one country, manufacture in another, and sell products worldwide.
Digital platforms: E-commerce giants like Amazon, Alibaba, and Flipkart have created a marketplace where even small sellers can access global buyers.
Financial markets: Stock exchanges, forex, and commodity markets now operate 24/7, reflecting real-time global demand and supply.
Interdependence: The U.S., China, EU, India, and emerging economies are tightly interconnected through trade flows.
But the same system is facing disruptions: trade wars, supply chain fragility (seen during COVID-19), and climate regulations are changing the rules of global commerce.
2. Technological Revolution in Trading
a) Artificial Intelligence (AI) and Algorithmic Trading
AI is already reshaping financial markets by analyzing vast amounts of data to make split-second trading decisions. In the future:
Smart trading bots will execute trades faster than humans can blink.
Predictive analytics will anticipate market movements with higher accuracy.
AI-powered supply chains will optimize shipping routes, reduce costs, and improve delivery timelines.
b) Blockchain and Digital Currencies
Blockchain technology is expected to transform how transactions are recorded and verified:
Smart contracts will allow automatic execution of trade deals once conditions are met.
Decentralized finance (DeFi) platforms will reduce dependence on traditional banks.
Central Bank Digital Currencies (CBDCs) will streamline cross-border transactions, reducing delays and costs.
c) Internet of Things (IoT) in Logistics
IoT sensors on ships, trucks, and warehouses will ensure real-time tracking of goods, reducing theft, fraud, and inefficiency. This will create transparent and secure supply chains.
d) Quantum Computing
Though still in its early stages, quantum computing could revolutionize trading by processing unimaginable amounts of data in seconds, making risk management and forecasting more precise.
3. Shifts in Global Economic Power
The global trading system of the future will not be dominated by a single country but shaped by multipolar powers:
China: Already the world’s largest exporter, China will continue to influence global supply chains. Its Belt and Road Initiative (BRI) connects Asia, Africa, and Europe.
India: With its fast-growing economy and digital adoption, India will become a central player in technology-driven trade.
Africa: The African Continental Free Trade Area (AfCFTA) will transform Africa into a huge unified market, attracting investment and boosting intra-African trade.
Middle East: With diversification beyond oil, countries like UAE and Saudi Arabia will become hubs for logistics, finance, and green energy trade.
Latin America: With abundant resources, Latin America will remain crucial in commodities but may also develop as a technology and manufacturing hub.
The future will see regional trading blocs strengthening as countries look for reliable partners in uncertain times.
4. Geopolitical Forces Shaping Trade
Trade has always been political, and the future will be no different.
US-China Rivalry: This competition will continue to shape tariffs, technology restrictions, and supply chain realignments.
Trade Wars & Tariffs: Countries may increasingly use tariffs as weapons in economic conflicts.
Friendshoring & Nearshoring: Instead of relying on distant countries, nations will shift production closer to home or to politically aligned nations.
Regional Agreements: Future trade may rely more on regional alliances (like ASEAN, EU, or USMCA) than global ones.
Geopolitical stability, or lack of it, will significantly impact the direction of global trading.
5. Environmental and Sustainability Dimensions
One of the biggest changes in global trading will be its alignment with sustainability goals.
Carbon Taxes and Green Regulations: Countries may impose taxes on goods with high carbon footprints.
Sustainable Supply Chains: Businesses will need to source responsibly, using renewable energy and reducing waste.
Circular Economy Models: Recycling, reusing, and remanufacturing will replace traditional “take-make-dispose” models.
Green Finance: Trading in carbon credits and green bonds will become mainstream.
Sustainability will not just be a moral choice but a competitive advantage in global trade.
6. Future of Financial Trading
Financial markets will see a massive shift in the coming decades:
Tokenization of Assets: Real estate, stocks, and even artwork will be represented as digital tokens for easy trading.
24/7 Global Markets: Trading will become continuous, with no dependence on local stock exchange hours.
Democratization of Finance: Retail investors will gain more power through apps and decentralized trading platforms.
Risk Management: With more data, future markets will manage volatility better, but new risks (like cyberattacks) will emerge.
7. E-commerce and Digital Trade
E-commerce is the fastest-growing part of global trade and will continue to evolve:
Cross-border Shopping: Consumers will shop directly from international brands with no intermediaries.
Personalized Experiences: AI will create customized shopping experiences for buyers worldwide.
Digital Services Trade: Software, online education, cloud storage, and entertainment will dominate future trade.
3D Printing: Manufacturing may shift closer to consumers as products can be printed locally, reducing shipping costs.
8. Challenges Ahead
While the future looks promising, it will not be without hurdles:
Cybersecurity Risks – As trade becomes digital, hacking and fraud risks will rise.
Inequality – Not all countries may benefit equally; poorer nations could be left behind.
Regulatory Conflicts – Different countries may adopt conflicting laws around data, privacy, and finance.
Climate Change – Extreme weather events could disrupt supply chains.
Over-dependence on Technology – Over-automation may create vulnerabilities if systems fail.
9. Opportunities for Businesses and Investors
The future of global trading will open new opportunities:
SMEs Going Global: Small businesses will reach international customers with ease.
Green Businesses: Firms offering sustainable products will see booming demand.
Digital Finance: Blockchain-based financial products will attract global investors.
Data-Driven Trading: Companies with strong analytics capabilities will outperform others.
Those who adapt quickly will thrive in the new global trading order.
10. Vision for 2050: What Global Trading Might Look Like
Let’s imagine the trading world in 2050:
Goods are shipped in autonomous, eco-friendly vessels powered by renewable energy.
Most financial trades happen via decentralized blockchain systems, accessible worldwide.
AI acts as a personal financial advisor, executing trades tailored to individuals’ goals.
Global supply chains are shorter, cleaner, and more transparent.
Developing nations, especially in Africa and Asia, become central players rather than passive suppliers.
Geopolitics continues to influence markets, but strong global institutions regulate fair trade practices.
The future will be faster, greener, more digital, and more inclusive.
Conclusion
The future of global trading will not be defined by one single trend but by the interaction of technology, geopolitics, sustainability, and consumer demand. It will be a world where AI, blockchain, green energy, and digital platforms play central roles. Countries that embrace innovation, build strong regional partnerships, and adapt to environmental responsibilities will lead the way.
Global trading will continue to be the lifeline of economies, but its form and rules will evolve dramatically. For businesses, investors, and policymakers, the key will be to stay agile, embrace change, and prepare for a future where trade is borderless, digital, and sustainable.

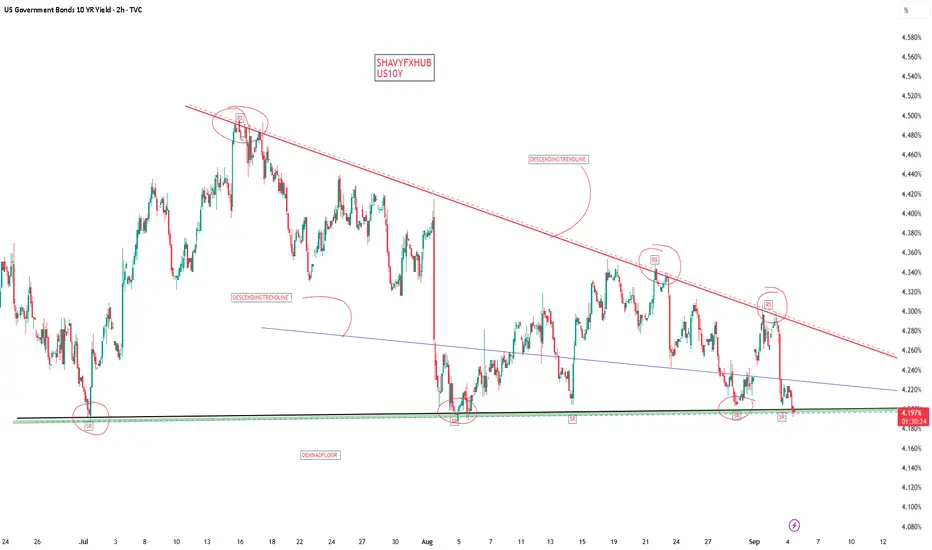
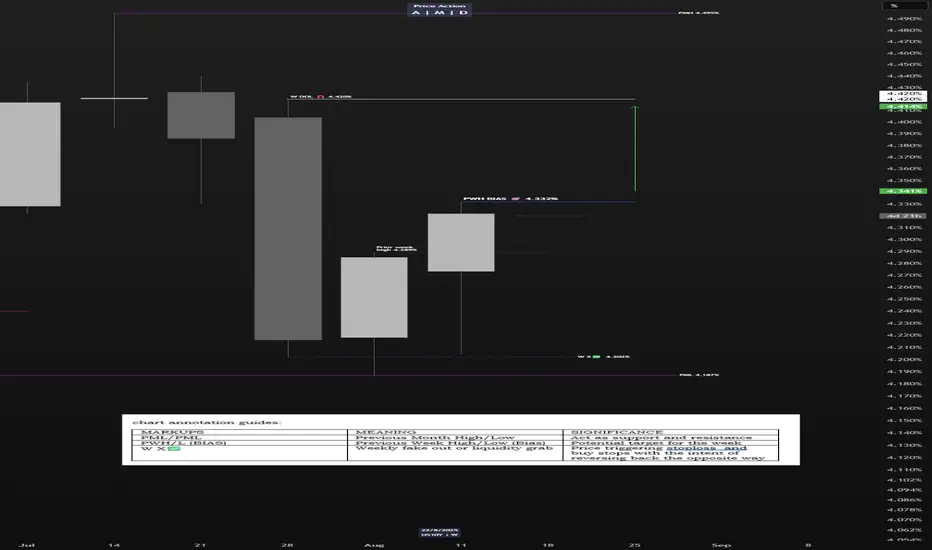
UST 10Y Technical Outlook for the week Sept 1-5 (updated daily) UST 10Y Technical Outlook for the week Sept 1-5 (updated daily)
Overnight
US Core PCE and Economic Indicators Summary
On August 29, 2025, the U.S. Commerce Department reported that the Personal Consumption Expenditures (PCE) Price Index rose 0.2% in July, down from 0.3% in June, matching market expectations. The annual PCE inflation rate remained at 2.6%. Core PCE, excluding food and energy, increased 0.3% monthly and 2.9% annually, up from 2.8% in June. The Federal Reserve, targeting 2% inflation, closely tracks these metrics. Market response was subdued, with the 10-year U.S. Treasury yield rising to 4.23% (up 2.3 basis points) and the dollar index increasing 0.21% to 98.09. Analysts suggest the data supports a 0.25% Federal Reserve rate cut in September, with potential additional cuts in October and December, contingent on stable PPI and CPI reports.
Source: Reuters via TradingView News
Economic Release www.myfxbook.com
For the week of September 1–5, 2025, key economic releases likely to impact U.S. Treasury yields include Tuesday’s ISM Manufacturing PMI and employment data, which could signal economic strength or weakness. Thursday’s Initial Jobless Claims and Trade Balance may reflect tariff effects and labor trends. Friday’s Nonfarm Payrolls and Unemployment Rate are critical for Federal Reserve rate decisions, with strong data potentially lifting yields (10-year at 4.26–4.39%) and weak data possibly lowering them. Markets are closed Monday for Labor Day, heightening focus on these releases amid tariff and inflation concerns.
September Outlook
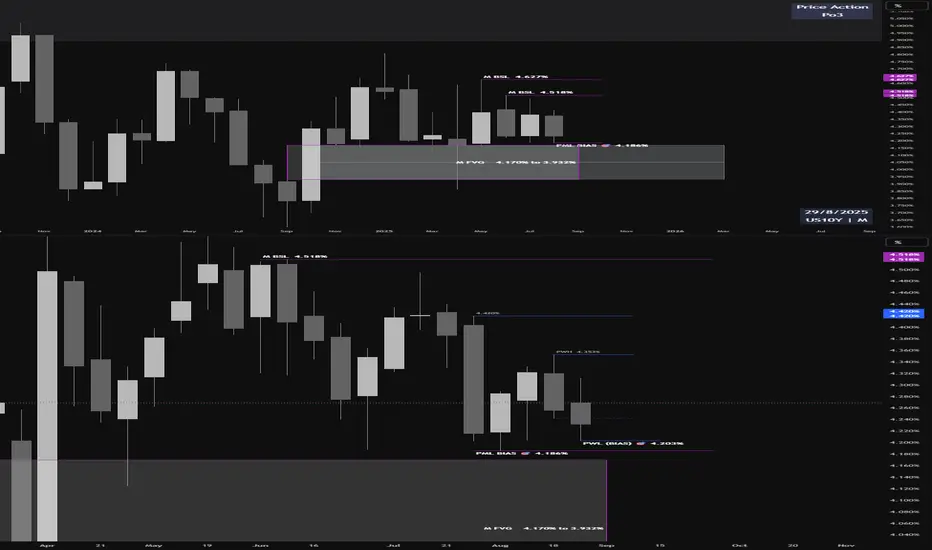
Monthly Analysis
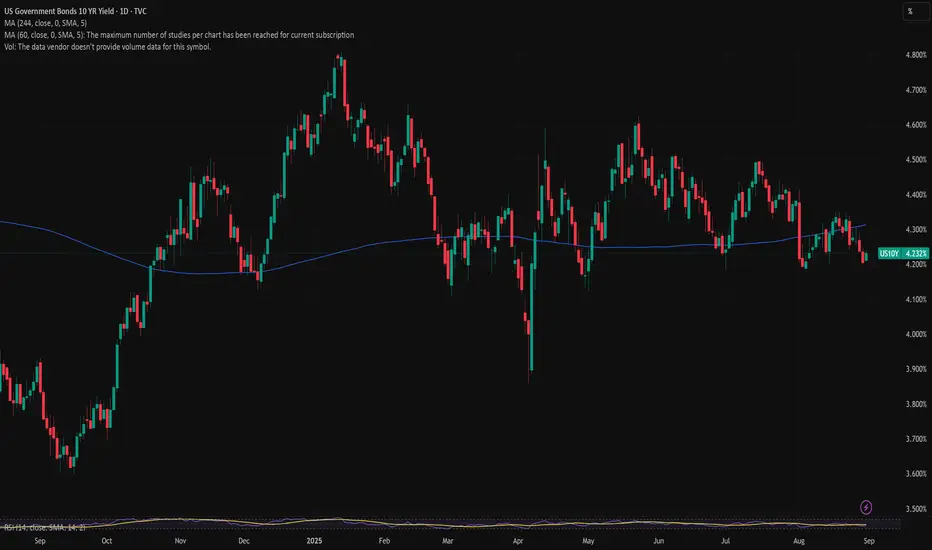
The monthly chart indicates that yields have been consolidating within a narrow range of 4.18% to 4.50%. This consolidation is primarily driven by factors such as tariffs and their implications for inflation, alongside expectations for monetary policy adjustments. A bias toward the lower end of this range aligns with market anticipation of an interest rate cut at the upcoming policy meeting.
Weekly Outlook
On the weekly chart, yields are expected to continue trending downward, potentially retesting the previous low of 4.18% to 4.20%. However, investors should exercise caution toward the end of the week, as the release of payroll data may introduce volatility and influence market dynamics.
**Disclaimer:** The technical analyses provided herein are based solely on my personal analysis and are intended for my own study and reference. They do not constitute a recommendation or solicitation to buy or sell any financial instruments. Any decision made by individuals based on this analysis is their own responsibility, and I assume no liability for any losses or damages incurred as a result of using this information. It is advisable to conduct thorough research and consult with a qualified financial advisor before making any investment decisions.
US 10Y TREASURY: testing 4.2%The US10Y Treasury yields continued to slide during the previous week, testing the level of 4,2%. Posted PCE figures for July of 0,2% and core PCE of 0,3% for the month, heated market expectation that the next feds rate cut will be in September. Still, some news headlines related to the dispute between the Fed Governor Lisa Cook and the US President, were not quite welcomed by the market, hence, 10Y yields modestly reverted on Friday, ending the week at 4,22%.
The week ahead will bring jobs data. The non-farm payrolls and JOLTs are due for a release, which might bring back some higher volatility. This will be the case if posted data are not in line with market expectations. In the opposite case, it could be expected that the market will continue to test the 4,2% current supporting level.
QQQ Lagged Correction Window2020–2021
Steepening, positive curve
Liquidity + stimulus = QQQ ripped higher
2022
Flattening, then inversion
QQQ corrected hard which matched the Fed’s aggressive hiking cycle
2023–2024
Deep inversion, recovery in stocks
Despite curve being negative, QQQ rallied
That was “don’t fight the tape” (liquidity + AI boom decoupled equities from bonds)
2025
Re-steepening
Curve now climbing back toward +0.60%
Historically, this “un-inversion” phase often lines up with late-cycle stress (Fed forced to cut, growth softens)
Stocks can stay up for a while, but risk of a sharper equity correction rises when steepening = recession, not growth
A steepening curve can mean 2 very different things,
Bull steepener (2Y falling fast) = Fed cutting because growth is weakening which is bearish for QQQ medium-term
Bear steepener (10Y rising) = market pricing in inflation/deficits which hurts tech via valuation compression
Given where the Fed is in cycle, the risk leans more toward bull steepening = slowdown signal
QQQ is at highs while the curve is re-steepening from record inversion which usually sets up a lagged correction window for equities
US10YUS 10-Year Treasury Yield
The yield on the US 10-Year Treasury is about 4.22% to 4.24%.
It has slightly decreased by approximately 0.02 percentage points from the previous session.
The yield remains elevated compared to last year (3.83%) but is below the long-term average of 4.25%.
This yield serves as a benchmark for long-term borrowing costs and reflects market expectations for growth and inflation.
US Dollar Index (DXY)
The DXY, which measures the US Dollar against a basket of major currencies, typically moves in correlation with US Treasury yields.
Historically, rising 10-year yields tend to strengthen the dollar as higher yields attract foreign capital.
Recently, the correlation has shown some divergence, with the dollar maintaining strength despite slight yield declines.
The DXY remains sensitive to Federal Reserve policy signals, inflation expectations, and global market dynamics.
Interest Rate Context
The Federal Reserve is expected to keep the federal funds rate steady around the current level (4.25%-4.50%) for now but market expectations for a rate cut in September have increased.
Treasury yields reflect these expectations and influence the dollar's value through changes in investment flows.
Summary
There is typically a positive relationship between the US 10-year Treasury yield and the USD index: higher yields suggest a stronger dollar and vice versa. However, market dynamics can cause short-term deviations. Current yields near 4.22% reflect a cautious but still higher rate environment, supporting the dollar's value amidst mixed economic signals
#US10Y #DOLLAR

UST 10Y Technical Outlook for the week Aug 25-29 (updated dailyUST 10Y Technical Outlook for the week Aug 25-29 (updated daily)
Overnight
Overnight, the yield on the 10-year US Treasury note dropped to 4.28%, a decline of nearly 10 basis points from its session highs, following Federal Reserve Chairman Jerome Powell’s keynote speech. Powell indicated that the balance of risks between inflationary pressures and a softening labor market has shifted, paving the way for a 25-basis-point rate cut at the Federal Reserve’s September meeting, with markets increasing expectations for further policy easing in the fourth quarter. Rate futures reflect a consensus for two total rate cuts in 2025, though 40% of the market anticipates three cuts. However, a steepening yield curve suggests ongoing inflation concerns, fueled by a strong Producer Price Index release and rising prices in ISM and S&P PMI data, highlighting a divergence between short- and long-term interest rate expectations. This development signals a shift toward looser monetary policy to support the labor market, but persistent inflationary pressures warrant caution. Stakeholders should closely monitor upcoming Federal Reserve communications and economic indicators, such as CPI and employment reports, to gauge the trajectory of interest rates and their broader market implications.
Economic Release for the week www.myfxbook.com
Weekly Outlook
With US Treasury yield, at 4.28% as of Friday, yield may trend lower this week (August 25–29) after Federal Reserve Chairman Jerome Powell signaled a 25-basis-point rate cut in September due to a softening labor market. Markets expect yields could dip further if upcoming data like durable goods orders and consumer confidence signal economic cooling, though persistent inflation concerns may limit declines. Monitor key economic releases for yield direction.
**Disclaimer:** The technical analyses provided herein are based solely on my personal analysis and are intended for my own study and reference. They do not constitute a recommendation or solicitation to buy or sell any financial instruments. Any decision made by individuals based on this analysis is their own responsibility, and I assume no liability for any losses or damages incurred as a result of using this information. It is advisable to conduct thorough research and consult with a qualified financial advisor before making any investment decisions.

US 10Y TREASURY: the Jackson Hole effectDuring the week markets were moving in a mixed mode, however, Friday brought the change, after the Fed Chair Powell's speech at Jackson Hole Symposium. The significant market reaction occurred when Chair Powell noted the possibility of further monetary policy easing in the coming period, implying a possible rate cut. Market is estimating, currently with 83% odds, that the next rate cut might occur at September's FOMC meeting. The 10Y US benchmark yields were moving around the level of 4,3% during the week, with a major move toward the 4,25% level at Friday's trading session.
Friday's move increased the probability that the currently major support level at 4,2% might be tested again in the coming period. Possibility during the week ahead. Still, it should be kept in mind that the Fed's major inflation gauge, the PCE index, is set for a release on Friday. Considering current sensitivity of markets on inflation figures, any deviation of the PCE indicator from market expectations might trigger higher market reaction.

Powell Delivers at Jackson Hole - NVDA and PCE Up NextNearly a 200% ATR move today in the S&P
SPY didn't close beyond all-time highs
QQQ didn't close beyond all-time highs
DIA did close above all-time highs
IWM continues its strong rally for August
I'm noticing some serious rotation into small cap, mid cap, and seeing the markets allocate
outside of Mag7, Tech, and AI
Powell all but guaranteed a September rate cut and the market loved it - yet prices aren't necessarily higher (yet). I still think the Aug-Oct window is ripe for a small correction and pullback to offer up better positioning for end of year
NVDA Earnings next week Wednesday
US PCE and Core PCE Friday to close out the month
I'm curious if the SPX 6500 resistance level will continue to hold firm - let's see
Thanks for watching!!!

Tariffs Effect on InflationIn April, inflation was at its lowest point. It was also the month when the 'Liberation Day' tariffs were introduced, applying a 10% baseline tariff to most countries.
But it wasn’t until August—when the July Core CPI rose to 3.1% from its April low of 2.8%— and now investors began to question whether inflation will be trending higher in the near future with now higher tariffs set in after 1st August.
10 Year Yield Futures
Ticker: 10Y
Minimum fluctuation:
0.001 Index points (1/10th basis point per annum) = $1.00
Disclaimer:
• What presented here is not a recommendation, please consult your licensed broker.
• Our mission is to create lateral thinking skills for every investor and trader, knowing when to take a calculated risk with market uncertainty and a bolder risk when opportunity arises.
CME Real-time Market Data help identify trading set-ups in real-time and express my market views. If you have futures in your trading portfolio, you can check out on CME Group data plans available that suit your trading needs www.tradingview.com

US 10Y TREASURY: yields rise on mixed signalsPosted US macro data during the previous week show resilience of the US economy on pressures coming from implemented trade tariffs. The July inflation stood at 0,2% for the month, in line with market expectations. The ability of the US economy to absorb inflationary pressures is increasing expectations among investors that the Fed might cut interest rates in September. However, on the opposite side, July retail sales at 0,5% m/m came higher from market estimate. At the same time, University of Michigan consumer inflation expectations both for this year and for the period of next five years, were also increased compared to previous post. The market reacted to such expectations by increased yields. The US 10Y benchmark yields turned to the upside and the level of 4,32%, where they are closing the week.
After a strong push of yields to the upside, some relaxation might be possible in the week ahead, where levels modestly below the 4,3% might be tested. It should be taken into account that the Jackson Hole Economic Policy Symposium will be held 21-23 August, where Fed Chair Powell is expected to hold a speech. Any new information, not previously shared with the market, might trigger higher volatility in US Treasury yields.

UST 10Y Technical Outlook for the week Aug 18-22 (updated daily)UST 10Y Technical Outlook for the week Aug 18-22 (updated daily)
Overnight
The yield on the 10-year US Treasury note stabilized at approximately 4.3% on Friday, following a rebound from 4.2% in the prior session, driven by economic data that tempered expectations for aggressive Federal Reserve rate cuts. Strong July retail sales growth, both in headline and control group figures, alongside an unexpected surge in import prices—the largest in 15 months despite new tariffs—fueled concerns about persistent inflationary pressures. These developments, combined with expansionary fiscal policies and higher deficit spending, have raised doubts about inflation aligning with the Fed’s target, despite earlier subdued CPI data. Market sentiment continues to favor a 25-basis-point rate cut at the Fed’s September meeting, but confidence in three total cuts for 2025 has diminished, as reflected in rate futures. Additionally, the latest 10-year note auction saw reduced participation from indirect bidders, influenced by tariffs and fiscal policy concerns.
Economic Release for the week Aug 18-22 www.myfxbook.com
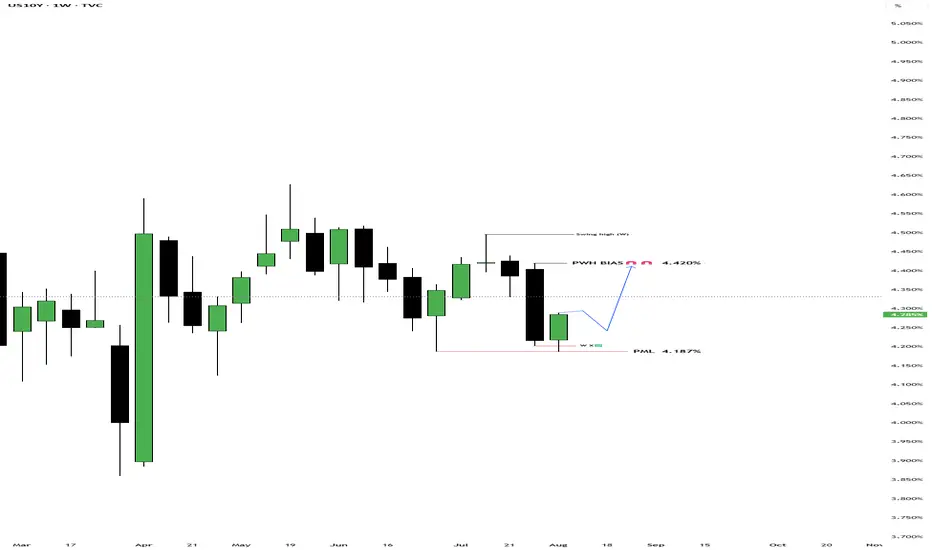
Weekly bias
Lets start the week with a long-term look. On the monthly chart () we can see that we are just trading within the previous month’s range. We almost broke the previous month low of 4.187% but aggressively bounced back up. We need to see an aggressive break above or below to define a new direction otherwise we are sideways within the range. On the weekly chart, ( ) after the market grabbed the liquidity at 4.202% the yield has bounced back and for the week I am anticipating previous week high, 4.332%, as a target.
**Disclaimer:**
The technical analyses provided herein are based solely on my personal analysis and are intended for my own study and reference. They do not constitute a recommendation or solicitation to buy or sell any financial instruments. Any decision made by individuals based on this analysis is their own responsibility, and I assume no liability for any losses or damages incurred as a result of using this information. It is advisable to conduct thorough research and consult with a qualified financial advisor before making any investment decisions.
10yr yield rangesSupport Zones (Bounce Potential):
First Support: Around 4.16% (the lower boundary of the channel and the 0.786 Fib level). If yields drop toward here, watch for a reaction or bounce.
Major Support: Near 3.96% (1.618 Fibonacci extension)—historically, such extensions offer strong bounce candidates if tested.
Resistance Zones (pullback potential):
Immediate Resistance: 4.42%–4.45% (upper channel and multiple EMA clusters). This is the first hurdle for upward moves.
Previous Top Target: Yields could rally toward 5.20% if resistance zones are cleared (marked by the big, bold orange arrow). That’s the previous cycle high where sellers may reappear.
Price Structure: The moving averages are tightly grouped, suggesting indecision. A breakout from this cluster—especially upward—could spark momentum toward 5%.
Channel Guide: The descending channel (yellow lines) acts like a garden fence; a move above the top suggests a break in trend and potential for a run higher.
Fibonacci Extensions: Not just mystical numbers! They help map out calculated support and resistance. See chart's blue/red lines for reference levels—each marks a potential turning point.
Bullish Scenarios: Two orange arrows show possible rally paths, indicating upward bias if supports hold.

US 10Y TREASURY: a bit of correction Two weeks ago U.S. Treasury yields were under a strong impact of weaker-than-expected non-farm payrolls data. The market reacted with a strong move toward the level of 4,2%. However, during the previous week some corrections in the level of yields occurred, as expected. The market digested the data and moved yields toward the 4,3%. The 10Y yields are ending the week at 4,28%.
The week ahead is also going to be an interesting one from the perspective of data. The inflation rate for July and the producers price index for July are scheduled for a release. The market will wage this data in a sense of its potential impact on the Fed's decision to cut or postpone rate cuts in September. Inflation data are especially relevant for market participants as it will provide an overview of the spillover effect of implemented tariffs on both inflation and the U.S. real economy.

UST 10Y Technical Outlook for the week Aug 11-15 (updated daily)UST 10Y Technical Outlook for the week Aug 11-15 (updated daily)
Overnight
The yield on the US 10-year Treasury note climbed to 4.27% on Friday, marking a fourth consecutive session of increases from a three-month low earlier in the week. This uptick follows market reactions to proposed tariffs on gold bars, President Trump’s nomination of Stephen Miran to the Federal Reserve’s Board of Governors, and concerns over potential politicization of the Fed. Weak economic indicators, including a lackluster jobs report, a subdued ISM Services PMI, and rising jobless claims, have heightened expectations for an interest rate cut next month. Additionally, recent Treasury auctions for 10-year and 30-year notes suggest declining demand for US debt. Investors are now focused on the upcoming CPI report and other economic data for further clarity on the US economy’s trajectory.
Economic Release for the week www.myfxbook.com
Weekly Bias
Based on last week's market activity, the market tested the prior week's low and the previous month's low before rallying strongly to close within the prior week's range. For the upcoming week, I anticipate the market may target last week's high of 4.42%. Key economic data, including CPI and inflation figures, are scheduled for release on Tuesday. These figures are likely to introduce significant volatility, so close monitoring is advised.
**Disclaimer:**
The technical analyses provided herein are based solely on my personal analysis and are intended for my own study and reference. They do not constitute a recommendation or solicitation to buy or sell any financial instruments. Any decision made by individuals based on this analysis is their own responsibility, and I assume no liability for any losses or damages incurred as a result of using this information. It is advisable to conduct thorough research and consult with a qualified financial advisor before making any investment decisions.
US10Y & T-Bond Future - Weekly AnalysisBias For The Week:
US10Y - Bullish Up to 4.341%
T-Bond - Bearish Down To 113.25

US 10-year yield threatening to breach key supportAfter Friday’s US jobs report, US Treasury yields fell across the curve. This caused the benchmark 10-year yield to retest the area below the 6M resistance level at 4.417% and settle at the 3M support from 4.211%. The mentioned support level has acted as a familiar floor since May this year. Therefore, a rejection of this base could refocus attention on 4.417% as an upside target, while a breakout might open the possibility for price to decline towards a 1Y support at 4.038%.
Written by the FP Markets Research Team

US 10Y TREASURY: NFP sank yields Although the previous week was full of important US macroeconomic data, including the FOMC meeting, still the weaker than expected NFP data impacted significantly the US Treasuries market. The 10Y US benchmark yields were holding around the 4,3% level during the week, however, weak NFP data pushed yields strongly to the downside, closing the week at the level of 4,22%. The support line at 4,2% was also tested at Friday's trading session. As per current sentiment, investors are now anticipating two rate cuts till the end of this year, one in September and another one in December by 25bps. Odds for September rate cut stand at 85% since Friday.
The week ahead will be a reflective one on financial markets, as there are no important data to be released. In this sense, markets will digest both this week's posted economic data as well as macro projections from the latest FOMC meeting. Some upward corrections are possible, at least till the level of 4,3%.
