The big week for Central BanksWhile the July FOMC meeting is likely too soon to initiate the first cut, it isn't too early to began preparations for a rate reduction in September.
US 30Y yield
No trades
Trade ideas

Bull Market in Housing to continue till 2027It would surprise many.
So far House prices have been holding up with rates going parabolic
Strong economies can usually handle a few years of stable rates in around 5%
Supercycle's generally last 16-18 years
As we saw in the great Bull run of 1982 to 2000
A repeat of this cycle timeframe: would mean
#Bitcoin top 2025 (2009 inception)
#Stocks 2026 (march 2009)
#property 2027 due to lag and time to make a sale. (End of 2011)

Why Are Bonds Still Crashing?Why are US, UK, and EU bonds still crashing since March 2020?
In this video, we are going to study the relationship between bonds, yields, and interest rates, which many of us find confusing. How can we understand them, and why are bond prices leading the yield, followed by interest rates this season?
10 Year Yield Futures
Ticker: 10Y
Minimum fluctuation:
0.001 Index points (1/10th basis point per annum) = $1.00
Disclaimer:
• What presented here is not a recommendation, please consult your licensed broker.
• Our mission is to create lateral thinking skills for every investor and trader, knowing when to take a calculated risk with market uncertainty and a bolder risk when opportunity arises.
CME Real-time Market Data help identify trading set-ups in real-time and express my market views. If you have futures in your trading portfolio, you can check out on CME Group data plans available that suit your trading needs www.tradingview.com

US30Y could push up tomorrow!Let's see how it plays out.
Price is in deep discount right now. Lets see!

US30Y headed up back to 5%?US30Y headed ⬆️ to 5%? If it breaks above 4.83%, then most likely it'll explore the further premium areas of the range.
US30Y is currently doing a very methodical climb up, as compared to a very rapid fall post Nov 23. This should be fun to watch! 🤩

US Bond Yield SMT DivergenceThis chart shows the bullish SMT Divergence happening across the US Treasury Bond yields.
According to the ICT methodologies this could indicate a potential continuation for the DXY Index higher.

US30Y: A Deep Dive into US30Y Bond Swing-Trade OpportunityThe US30Y bond is a type of loan that the United States government takes from investors. It's called a "30-year bond" because it takes 30 years for the government to pay back the loan in full. When you buy a US30Y bond, you're essentially lending money to the government, and in return, they promise to pay you back the amount you lent, plus interest, over the 30-year period.
People trade US30Y bonds because they can buy and sell them before they mature. This means you can potentially make money by selling the bond for more than you paid for it if its value goes up, or you might sell it for less if its value goes down. The value of the bond can change based on factors like interest rates, inflation, and economic conditions.
Most investors often see US30Y bonds as a safer investment compared to stocks because they're backed by the government.
However, they still carry risks, such as changes in interest rates or inflation levels. So, people who trade US30Y bonds need to carefully consider these factors before making investment decisions.
Now let's get into the detailed analysis of this bond
12M:
6M:
3M:
1M:
1D:

Short term yields still weak, longer term reversedWhat a difference 11 hours makes.
The 1 & 2 Yr #Yield are STILL under resistance & are weakening.
10 & 30 Yr completely reversed once markets opened. But this tends to be normal, pretty frequent.
This is why waiting for a CLOSE is of utmost importance. IF we CLOSE here, last night's thinking is NO MORE and the best plan of action is to WAIT.
TVC:TNX

Interest Rates NOT showing cuts...Let's keep looking at #InterestRates. Gives us an idea of what the Fed may do.
The 1 & 2 Year are still under their RESISTANCE level. Struggling a bit, but not breaking down. Trend is still there, weak though.
10 Yr looks like it wants to break the resistance zone.
30 YR looks like it's gone. Does not look like it wants to retrace at the moment.
#FederalReserve TVC:TNX

US30Y yield back to New high (Bearish bond view)On the back of strong prices data which were not really consistent with the temporary relief in inflation but rather calling for a sustained trend.
US30Y is likely to revisit new high, breaking our

US30Don't repeat patterns. Repeat logic. And when you're wrong, dissect the logic. Then you'll realise it's the same logic being used again and again.

CRE & Small Banks coincide with each otherSmall banks account for about 70% of #commercialrealestate.
Small #banks are considered those with assets less than $10B.
We've been bearish CRE for a long time. We believe that this sector will likely not get better anytime soon.
#interestrates are still holding fairly strong. They are at banking crisis levels or higher.
TVC:TNX

Treasury Yields look ripe for further movesCurrent state of the short and long term #Yield.
The 1Yr is underperforming against the 2Yr yield. However, it looks like it wants to push higher.
10Yr vs 30Yr
The 10Yr is performing lil better than 30 but.......
The 30Yr has a BULLISH short term crossing over longer term moving avg, RSI also looks strong. IMO yields are looking good. Seems like there is still treasury selling pressure.

Looking at short & long term yieldsGood Morning Update
Looking at the short & long term Bond Yields.
Short term (3M & 6M) yields are trading above bank crisis levels.
The 1Yr & 2Yr #yield are underneath the crisis levels.
The 10Yr is currently at those levels & 30Yr is above said levels.
Makes one think....... How much longer can #banks support these levels?
CRYPTOCAP:BTC AMEX:GLD AMEX:SLV
------------------------------------
Digesting longer term data = 10 & 30Yr #yield.
Higher lows
Bullish moving average crossover > circles
Moving avgs trending higher
Forming small uptrend
2nd pic = WEEKLY
Back above previous uptrend
Trading under moving avgs
TVC:TNX #Gold #silver #BTC

$DXY, long and short term rates looking betterGood Morning! Let's get it done!
Look at #yield for 1yr - 30Yr. What do you see?
Last week we said they looked 2b bottoming out a bit.
Do any of these look weak to you?
RSI above halfway point, solidifying the possible bottoming process.
Short term
#Interestrates keep testing the top part of the white line. The more something is tested the weaker it becomes and the higher the chance of it breaking through.
Long term
Forming higher lows.
TVC:DXY

US30Y
Currently US30Y is in the selling zone, but if the red average indicated by the blue arrow is broken and we enter the green zone, the market will be in the buying phase.

10 & 30 Year yields are at decent to strong support levelsThe 10 year & 30 Yr #yield are at support levels.
Looking at Daily charts:
The longer term, 30Yr, looks better than TVC:TNX (10Yr)
Looking at Weekly charts:
The 10Yr support level looks strongest @ 3.3%.
All sorts of support levels and trendlines were broken recently.
The 30 Yr trendline is certainly broken & Strong Support is found here.

Requested Update: Bond Yields Complete a 5-wave pattern higherWe have our first indication of a top in bond yields with price overlapping and losing it's impulsivity to the upside. However, a top is not confirmed until yields breach 3.40% which is our wave 4 of one lesser degree.
To do so should confirm the beginning of our wave 2 decline into the target box, and over time.

Anlysis of the 30Y treasury BondHere is my analysis of the 30Y treasury Bond. In fact , for the past weeks , this market has been trading lower. And my point is that it will continue trading lower until we reach the sellside liqudity level. That means that we could continue to witness bullish prices on indices due the invese correlation between the Bond market and the indices market

Interest rates over layThis is 30 year yields with 10 20 and the fed funds rate over laid on top for my purposes:)

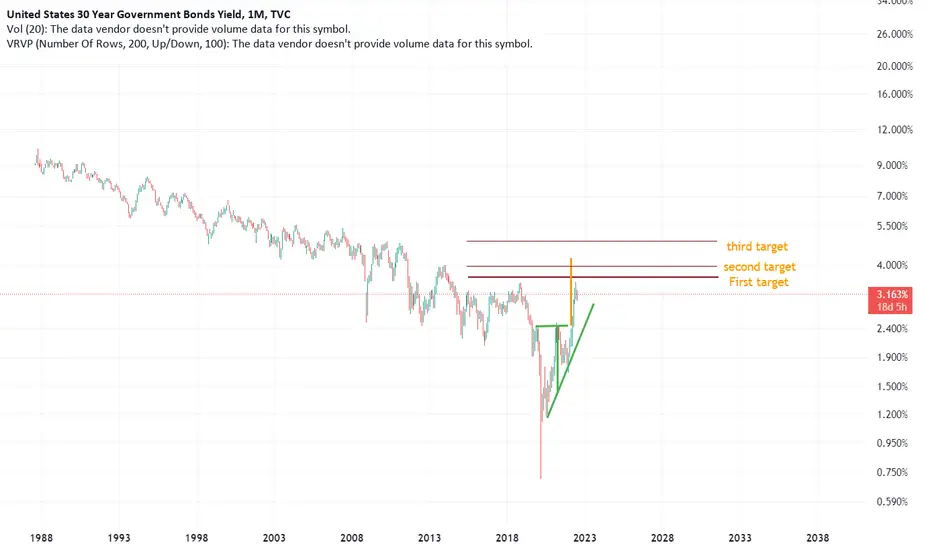
US30Y targets in this analysis , i gave targets for US30Y , based on the macro env , and the W pattern in addition to ichimoku strong resistancec.
not a financial advice
thank you
US 30yr yieldsUpdate on US long end rates view. YCC or not this is what I think could happen over next 2 years. When I was on the fixed income trading desk at Lehman in '88 we had short end paper that yielded double digits....and given the amount of fiat being printed this could be just the start of the back up in yields

Still a secular bull market for yieldsHate to disappoint you fixed income bulls
We are in the early stages of a secular bull market for yields (started 2020) as inflation will prove persistently bad
There may be pullbacks along the way but the path is higher
Long bond yield>10>50>200 ma
