Time to buy short duration treasury bonds?The Fed funds rate is higher than the 30 year treasury interest rate.
The last time that happened was in 2000 and 2008.
What happened back then was that the stock market and the 2 year treasury interest rate both dropped significantly.
Will history repeat itself?
US 30Y yield
No trades
Trade ideas

Weekend Update: Bond yields to move higherI received a request to update this chart. Thank you @Braeden2
The US30Y held it's wave 4 bottom in the .382% area of wave 3. The last time I posted this chart we had not yet embarked on our 5-wave pattern higher in what I'm counting as a wave 5. Today we see we have a wave 1 and 2 in place. Additionally, you'll notice how our recent wave 4 structure alternates with our previous wave 2 structure. We should have been expecting wave 4 to be deep and quick, were as our wave appears shallow and long. That is precisely what occurred.
From here I would expect within the next month to begin to clearly subdivide in our wave 3 of 5 and target yields in the 4.294% to 4.529%. This would be for our wave 3. Upon that happening we'll need a 4 and then the ultimate destination for this structure is in the target box for wave 5.
I've enjoyed the ongoing conversations in Trader-World about who is right?...The bond market or the Fed? I don't follow bonds closely, nor have I ever traded them, therefore I don't what constitutes victory for bonds or The Fed.
But I will pose this question to those reading this...what does 4.895% yield on the 30y mean? Who wins, Bonds, The Fed, or both?
Best to all,
Chris

Micro Drift Patterns One of the more powerful but under-appreciated categories of patterns are very short term drift patterns in strongly trending markets. Flags, pennants and small lateral trading ranges can all fall into this category. The patterns are fractal, that is, they appear across all time frames.
I find small multi drift patterns invaluable. First, they are ubiquitous. They appear in virtually all trends and time frames. Second, their completion affirms that underlying trend remains intact. Finally, the manner in which they develop, for instance, the slope, extent and volume of the counter trend move can all offer clues as to the underlying strength of the trend.
Most strong trends unfold in a push - drift - push pattern, sprinting quickly in the direction of the trend, accruing a short term overbought or oversold, and then drifting counter to the sprint. As these patterns "drift" against the prevailing trend, they alleviate the short term overbought or oversold condition that accrued during the sprint. You can think of the drift as a "pause that refreshes."
It is important that the market DRIFT. The best examples contain overlapping price ranges (in whatever perspective you are working in) and don't typically retrace much of the prior sprint. Volume should generally decline throughout the pattern, particularly if the pattern builds over 5-10 periods. The best examples have substantial range overlap from day to day.
The classic literature requires a sharp move, or a flag pole, for these patterns to fly from, a decline in volume as the pattern builds and that the pattern last no more than 10-15 bars. In my experience, finding drift patterns that fill all these "requirements'' is difficult. My personal approach minimizes the requirements. As long as the pattern occurs after a decent thrust (I prefer the thrust to go to new high or low ground) and then drifts against the prevailing trend, I can use it to develop either a fresh entry to the prevailing trend or simply as a validation of the underlying trend.
Importantly, the pattern is typically better defined in the chart of one perspective lower. For instance, drift patterns in the weekly chart can be better seen on the daily chart, and drift patterns on the daily, in the hourly.
And finally, many of the topics and techniques discussed in this post are part of the CMT Associations Chartered Market Technician’s curriculum.
Good Trading:
Stewart Taylor, CMT
Chartered Market Technician
Taylor Financial Communications
Shared content and posted charts are intended to be used for informational and educational purposes only. The CMT Association does not offer, and this information shall not be understood or construed as, financial advice or investment recommendations. The information provided is not a substitute for advice from an investment professional. The CMT Association does not accept liability for any financial loss or damage our audience may incur.

Interest rate up to at least 6.5% in 2023, why?The Fed chairman has given the market a very important clue on 13 Dec 22.
At what level will he consider an interest rate cut?
He said “I wouldn't see us considering rate cuts until the committee is confident that inflation is moving down to 2% in a sustained way,” meaning only if CPI is heading nearing 2% then it is hopeful to see a rate cut.
Market consensus for CPI to range between 5% to 8..9% for this year. If this is true, the Fed is likely to continue to hike the rate moderately at 0.25% in each meeting just to bring inflation down.
I am seeing this as the best case scenario.
Today’s content:
Strategy in an inflationary environment:
i. Commodity – Buy them
ii. Stock market – Trade them
Can inflation be hedged and can we trade into the interest rate uptrend?
CME Micro 30 Year Yield Futures
Minimum fluctuation
0.001 point = $1
0.01 point = $10
0.1 point = $100
1 point = $1,000
Disclaimer:
• What presented here is not a recommendation, please consult your licensed broker.
• Our mission is to create lateral thinking skills for every investor and trader, knowing when to take a calculated risk with market uncertainty and a bolder risk when opportunity arises.
CME Real-time Market Data help identify trading set-ups in real-time and express my market views. If you have futures in your trading portfolio, you can check out on CME Group data plans available that suit your trading needs www.tradingview.com

Interest rate up to at least 6.5% in 2023, why?The Fed chairman has given the market a very important clue on 13 Dec 22.
At what level will he consider an interest rate cut?
He said “I wouldn't see us considering rate cuts until the committee is confident that inflation is moving down to 2% in a sustained way,” meaning only if CPI is heading nearing 2% then it is hopeful to see a rate cut.
Market consensus for CPI to range between 5% to 8% for this year. If this is the case in 2023, the Fed is likely to continue to hike the rate moderately at 0.25% in each meeting just to bring inflation down.
I am seeing this as the best case scenario.
We can participate in hedging the market and trading the interest rate in this example.
CME Micro 30 Year Yield Futures
Minimum fluctuation
0.001 point = $1
0.01 point = $10
0.1 point = $100
1 point = $1,000
Disclaimer:
• What presented here is not a recommendation, please consult your licensed broker.
• Our mission is to create lateral thinking skills for every investor and trader, knowing when to take a calculated risk with market uncertainty and a bolder risk when opportunity arises.
CME Real-time Market Data help identify trading set-ups in real-time and express my market views. If you have futures in your trading portfolio, you can check out on CME Group data plans available that suit your trading needs www.tradingview.com
I hope this tutorial will be helpful, in enabling you to read into the market with greater clarity.
Stay-tune for the video version shortly, we will do more in-depth study.

Bitcoin 8500? ,Gold $2200?, New Highs for the Dow Jones?2022 has been very difficult year for traders and investors, but this new year can be much better, here we will guide you in the 2023 in your quest to learn how to trade.

US30Y: Bulls Will Push
Here is our technical outlook for US30Y.
US30Y is trading within a demand zone.
Based on our view the price will rise.
❤️ Please, support our work with like & comment! ❤️

US30 Technical Analysis! Sell!
Hello,Traders!
US30 went down from the
Horizontal resistance above
Just as I predicted but is now
Retesting a horizontal support
From where a local rebound
Is somewhat likely
Buy!
Like, comment and subscribe to boost your trading!
See other ideas below too!

Evening Update: Is the 30Y running away from usRecently I posted my analysis of the 30Y yield. That posts is here .
Since then bond yields have moved higher. As I stated in my original post this could end up between 5%-6% before any meaningful pullback.
Best to all,
Chris

Morning Update: 30Y Bond Yield This chart appears pretty well behaved. This decline in yield has come right into the .382% retracement area of wave 3 for a wave 4 bottom. If the 30Y bond continues to behave...yields are headed above 5%. To some of you reading this...that may sound like a stretch.
To those who like correlations...I wonder what happens to stocks if this plays out?
#whoisrightBonds_or_Stocks?
Best to all,
Chris

US30Y: Bearish Continuation
Hey traders,
Here is our forecast on US30Y.
US30Y reached a strong resistance area.
Based on our outlook the market will dump to the next structure support.
❤️ Please, support our work with like & comment! ❤️

✅US30_BONDS BEARISH BIAS|SHORT🔥
✅US30_BONDS price went up sharply
But a strong resistance level was hit
Thus, as a pullback is already happening
And a move down towards the target shall follow
SHORT🔥
✅Like and subscribe to never miss a new idea!✅

US30Y Short From Resistance! Sell!
Hello,Traders!
US30Y went up sharply
Retested the horizontal resistance
And made a pullback so I think
We will see a retest
Of the support level below
Sell!
Like, comment and subscribe to boost your trading!
See other ideas below too!

GOVERNMENT BONDS YIELD. INVERTED CURVEWhat are GOVERNMENT BONDS YIELD?
Bonds are Fixed Income instruments that allow investors to anticipate the flow of funds they will receive.
What does an inverted yield curve mean?
Put simply, this means that short-term US debt is more profitable than long-term debt. Economic theory says that in a “normal” situation, long-term lending should be more profitable than short-term lending.
An inverted yield curve occurs when the yield on short-term bonds (US03MY, US06MY, US01Y) is greater than the yield on longer-term bonds (US30Y, US20Y) .
This is bad for the economy and worse if it is the United States because it means that they are relying on the economy in the short term since the "normal" thing is that long-term bonds give better yields.
Some economists and analysts see in this situation an indicator that a next economic crisis is coming, either in the form of a slowdown in GDP or even a recession.

Treasury 30Y BondsTreasury 30Y Bonds
Reversion
Lower interest rates predictor
CPI + speech tomorrow.

US30 Bearish Bias! Sell!
Hello,Traders!
US30 is trading in a downtrend
And the price is retesting
The broken horizontal key level
Which is now a resistance
From where a move down
Is to be expected
Sell!
Like, comment and subscribe to boost your trading!
See other ideas below too!

A Massive Selloff found a bottom?Is 4% yield the end for the 10 year?
The fed is talking about increasing the base rate further so I doubt it is the bottom but we do see a similar move here versus the begging of the sell off. Moving about .23% on the yield today versus the beginning of the sell off does leave one to wonder. Are we close to the bottom? Does this mean that equities have the green light??
I expect some more volatility to come as we head into elections but I suspect we are close to a bottom for 2022. I still see a run up into 2023 maybe even a violent new high with a drop that all these bears are really looking for in 2023.

Bonds Yield in full flight, breaking 2018 highsUS 30-Year Government Bonds Yield in full flight, breaking 2018 highs. Major support at 3.80
A complete five-wave pattern could land bond prices at 4.85-5.11

30 year yield breakoutLooking at this chart it looks like the bond yields on 30 year treasuries capitulated between January and March 2020 and now we could be in a trend reversal from the large downward parallel channel. Indeed the long bond sell off seems to be accelerating as the price has now broken out of the upward sloping channel.
US30Y - The technical pattern is in a powerful breakout30Y have benefited from rotational flows out of the S/T part of the curve into longer dated, Technically speaking the 30Y has broken out of downward trend and is indicating a strong upside move, with a first target around 3.71/3.75% by next month.

US30Y just needs some airIt needs air and to me this is it - correction time, eoy should be bullish.

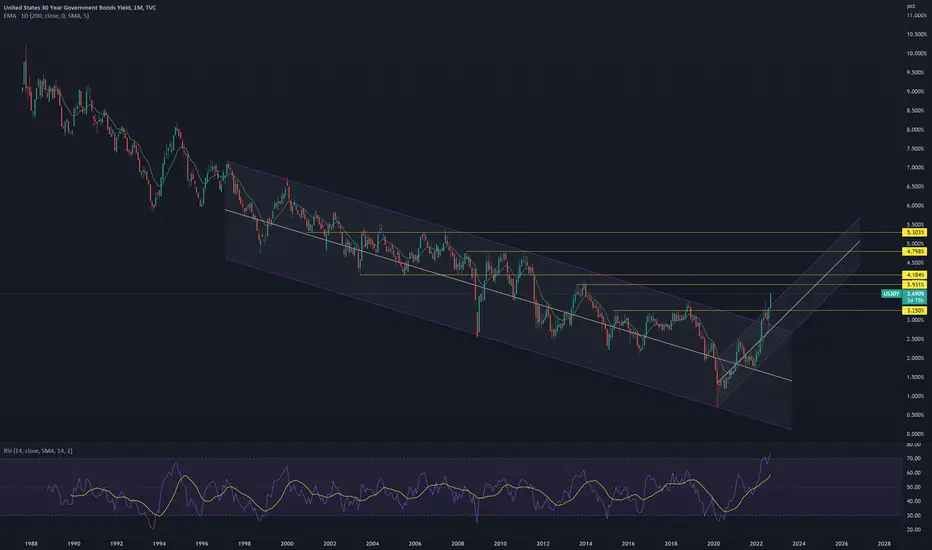
Four decades of downtrend has broken - Yield / Interest RateAll the fixed tenure yields have broken above their four decades of downtrend. - 2yr, 5yr, 10 yr & 30yr
To note, the shorter end, the fixed 2 year tenure yield is climbing faster than the longer end, the U.S. fixed 30 year tenure government bond yield.
The year closing, it will be crucial to determine the trend transition; from this long-term downtend to uptrend.

Are we heading towards a global crash?I notice that whenever a crash occurs, bond market would be offloaded prior to the event.
Order block was printed on the 1st of October 2018 prior to covid. Bearish fair value gaps printed and rebalanced in 2019 prior to the crash.
Note that Buyside liquidity (BSL) has been taken out, I would speculate that the market is currently printing a bearish order block. (up move before the down move)
